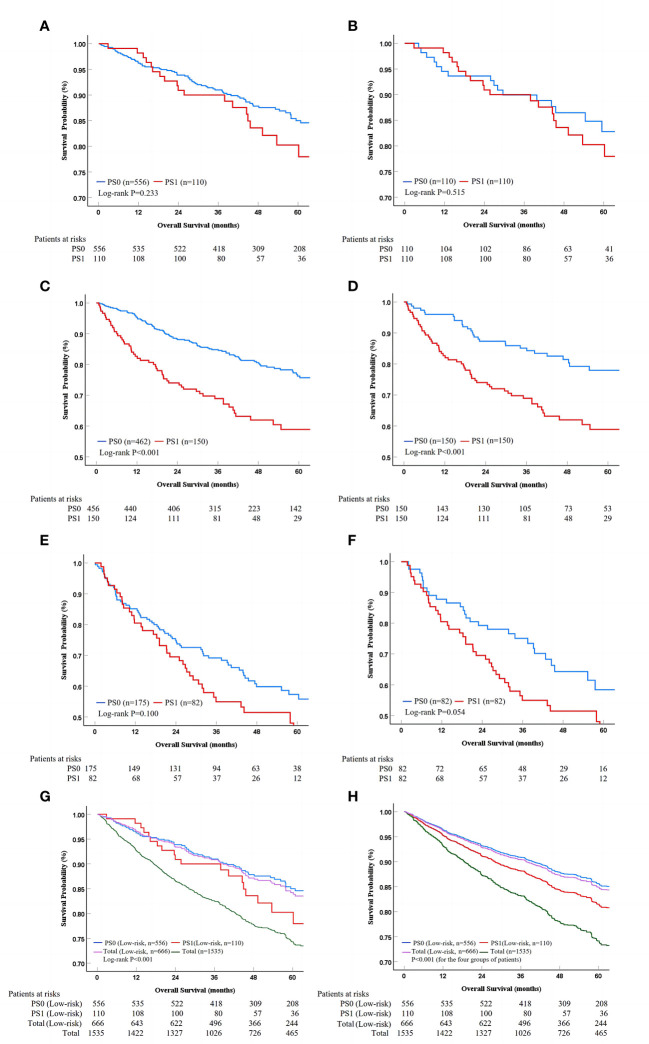
Figure 4.
Survival analysis in different risk stratifications. PS, performance status; PSM, propensity score matching. The survival difference between PS0 and PS1 patients in the whole and PSM cohorts for low-risk (A, B), medium-risk (C, D), as well as high-risk stratification (E, F) according to Kaplan-Meier method. The low-risk patients could be identified from the whole cohort, while the PS score lost its prognostic value in univariate and multivariate analysis (G, H).

