. 2023 Jul 10;12:e82597. doi: 10.7554/eLife.82597

Figure 1. Effects of 0.5% oxygen on extracellular metabolite fluxes in lung fibroblasts.

(A) Lung fibroblasts (LFs) were cultured in 21% or 0.5% oxygen beginning 24 hr prior to time 0. Samples were collected every 24 hr for 72 hr. (B) Growth curves of LFs in each experimental condition (n=8). (C) Growth rates from (B) were determined by robust linear modeling of log-transformed growth curves. (D) Representative immunoblot of LF protein lysates cultured as in (A). (E) Relative change in HIF-1α protein levels from (D) normalized to 21% oxygen at time 0 (n=4). (F) Relative change in GLUT1 mRNA levels normalized to 21% oxygen treatment at time 0 (n=4). (G) Relative change in LDHA mRNA levels as in (F). (H) Relative change in LDHA protein levels as in (E). (I) Extracellular fluxes of glucose (GLC) and lactate (LAC) (n=8). By convention, negative fluxes indicate metabolite consumption. (J) Extracellular fluxes of pyruvate (PYR) and amino acids. Data are mean ± SEM (* p<0.05).

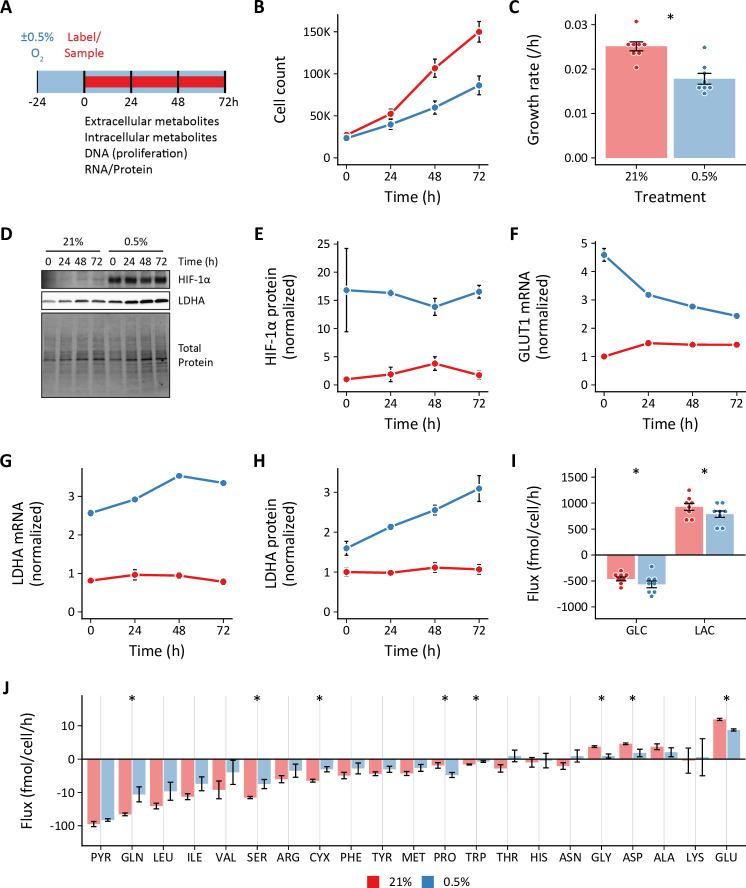
Figure 1—source data 1. Uncropped blot images for Figure 1.

Figure 1.

Figure 1—figure supplement 1. Supporting data for extracellular flux calculations.

Figure 1—figure supplement 1.

(A) Cell viability as assessed by live/dead cell staining with acridine orange plus propidium iodide did not differ between 21% and 0.5% oxygen culture conditions (n=3 technical replicates). (B) Predicted well volumes were estimated from the change in culture plate mass over the experimental time course. Evaporation rates differed depending on the culture conditions and treatment. Although the mean evaporation rate is depicted, experiment-specific evaporation rates were used to calculate fluxes for each biological replicate (C) Metabolite accumulation (positive values) and degradation (negative values) rates. Data are mean ± SEM of three to eight biological replicates. Rates significantly different from 0 (*) based on a probability value <0.05 using Student’s one-sample t-test were incorporated into flux calculations.
Figure 1—figure supplement 2. Quantifying lactate efflux generated by [U-13C6]-glucose.

Figure 1—figure supplement 2.

Cells were cultured in MCDB131 supplemented with 8 mM [U-13C6]-glucose. Conditioned medium was collected, spiked with [D8]-ᴅʟ-valine internal standard, and analyzed by LC-MS. (A) A standard curve was generated from the peak area ratios of lactate and the internal standard prepared in unconditioned MCDB131 medium. (B) Lactate accumulates more slowly in the conditioned medium from hypoxic cells (n=3 biological replicates). (C) Lactate efflux was decreased in hypoxia, similar to the data obtained from enzymatic lactate assay. Data are mean ± SEM (* p<0.05).
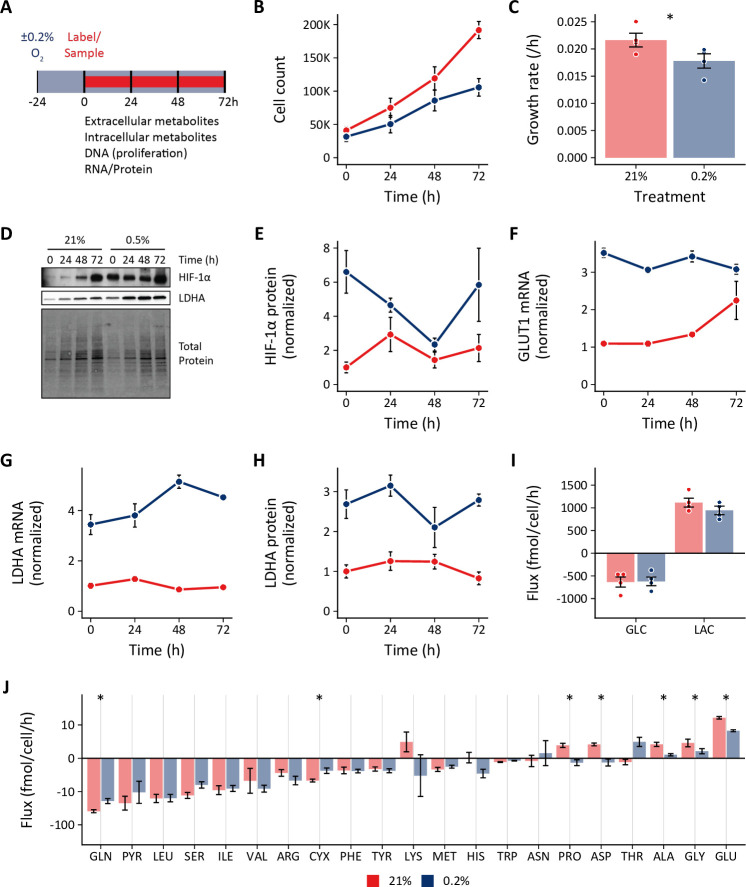
Figure 1—figure supplement 3. Effects of 0.2% oxygen on extracellular metabolite fluxes in lung fibroblasts.

Figure 1—figure supplement 3.

(A) Lung fibroblasts (LFs) were cultured in 21% or 0.2% oxygen beginning 24 hr prior to time 0. Samples were collected every 24 hr for 72 hr. (B) Growth curves of LFs in each experimental condition (n=4). (C) Growth rates from (B) were determined by robust linear modeling of log-transformed growth curves. (D) Representative immunoblot of LF protein lysates cultured as in (A). (E) Relative change in HIF-1α protein levels from (D) normalized to 21% oxygen at time 0 (n=4). (F) Relative change in GLUT1 mRNA levels normalized to 21% oxygen treatment at time 0 (n=4). (G) Relative change in LDHA mRNA levels as in (F). (H) Relative change in LDHA protein levels as in (E). (I) Extracellular fluxes of glucose (GLC) and lactate (LAC) (n=4). By convention, negative fluxes indicate metabolite consumption. (J) Extracellular fluxes of pyruvate (PYR) and amino acids. Data are mean ± SEM (* p<0.05).
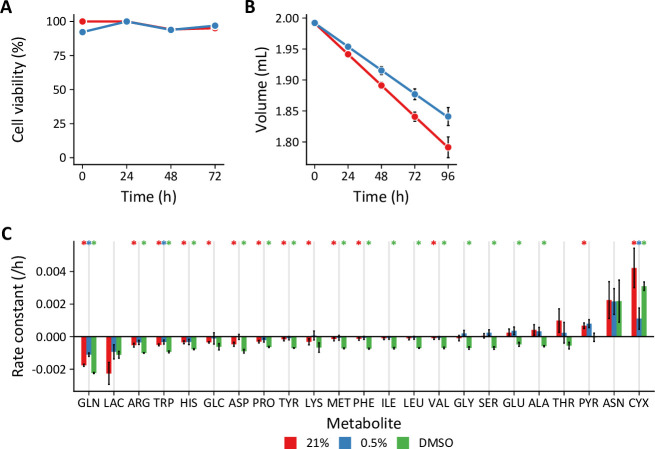
Figure 1—figure supplement 3—source data 1. Uncropped blot images for Figure 1—figure supplement 3.
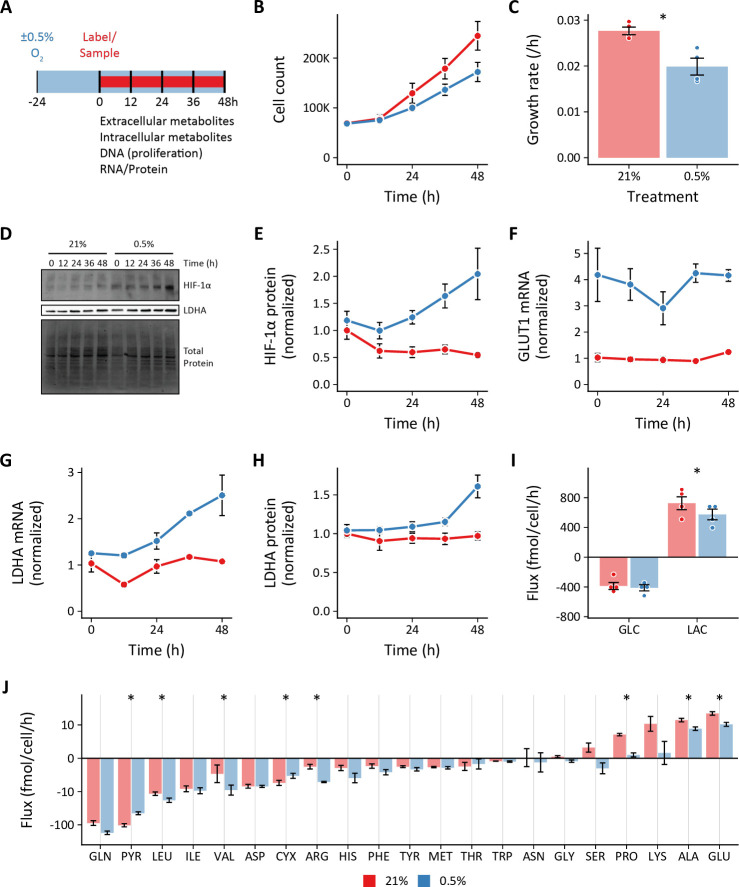
Figure 1—figure supplement 4. Effects of 0.5% oxygen on extracellular metabolite fluxes in pulmonary artery smooth muscle cells.

Figure 1—figure supplement 4.

(A) Pulmonary artery smooth muscle cells (PASMCs) were cultured in 21% or 0.5% oxygen beginning 24 hr prior to time 0. Samples were collected every 24 hr for 72 hr. (B) Growth curves of LFs in each experimental condition (n=4). (C) Growth rates from (B) were determined by robust linear modeling of log-transformed growth curves. (D) Representative immunoblot of LF protein lysates cultured as in (A). (E) Relative change in HIF-1α protein levels from (D) normalized to 21% oxygen at time 0 (n=4). (F) Relative change in GLUT1 mRNA levels normalized to 21% oxygen treatment at time 0 (n=4). (G) Relative change in LDHA mRNA levels as in (F). (H) Relative change in LDHA protein levels as in (E). (I) Extracellular fluxes of glucose (GLC) and lactate (LAC) (n=4). By convention, negative fluxes indicate metabolite consumption. (J) Extracellular fluxes of pyruvate (PYR) and amino acids. Data are mean ± SEM (* p<0.05).
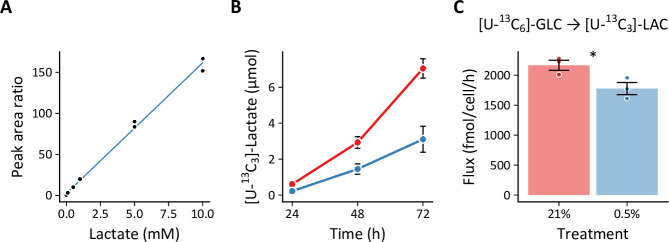
Figure 1—figure supplement 4—source data 1. Uncropped blot images for Figure 1—figure supplement 4.