. 2023 Jul 10;12:e82597. doi: 10.7554/eLife.82597

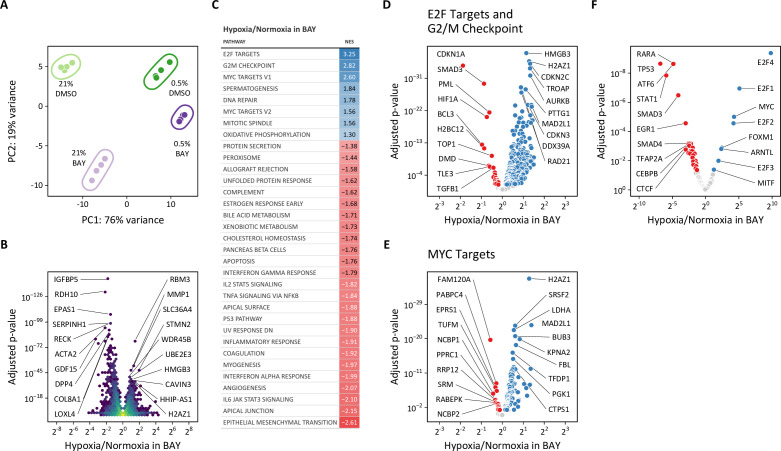
Figure 10. Transcriptomic analysis of molidustat treatment in normoxia and hypoxia.

(A) Principal component analysis of transcriptional changes in lung fibroblasts following 72 hr of treatment with 0.5% oxygen or molidustat (BAY), separately or together (n=4). (B) Volcano plot illustrating the effects of hypoxia in BAY-treated cells on gene expression. (C) Gene set enrichment analysis of transcripts from (B). (D) Volcano plot of those transcripts comprising the E2F Targets and G2/M Checkpoint Hallmark gene sets. (E) Volcano plot of those transcripts comprising the MYC Targets V1 and V2 Hallmark gene sets. (F) Volcano plot illustrating the results of a transcription factor enrichment analysis suggests mechanisms for differential regulation of gene expression following hypoxia or BAY treatment.

Figure 10—source data 1. Source data for Figure 10C.

Figure 10.

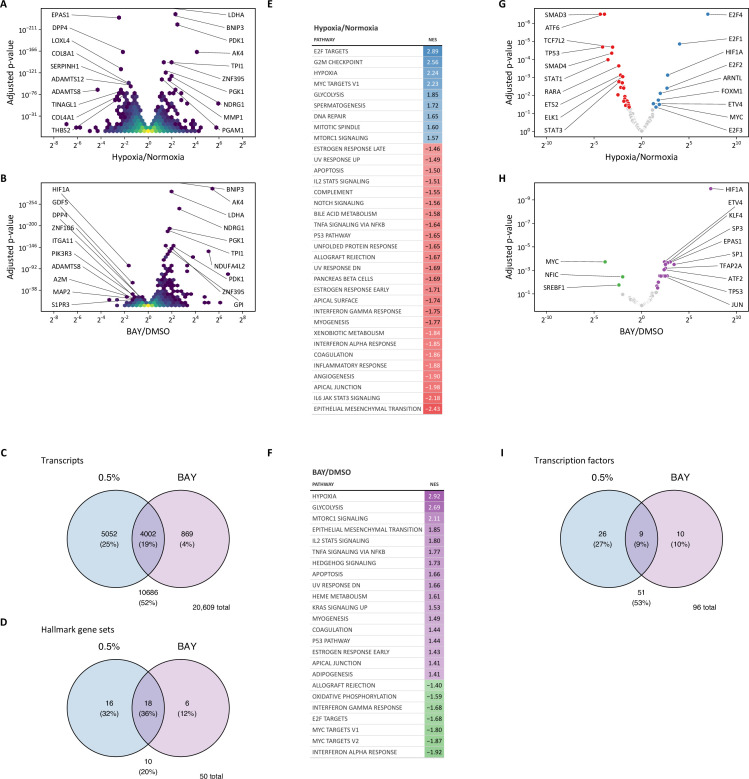
Figure 10—figure supplement 1. Transcriptomic profiling of hypoxia and BAY-treated lung fibroblasts.

Figure 10—figure supplement 1.

(A) Volcano plot of differentially expressed genes following 0.5% oxygen culture. (B) Volcano plot of differentially expressed genes following BAY treatment. (C) Venn diagram illustrating the number of differentially expressed transcripts following hypoxia (blue) or BAY treatment (purple). (D) Venn diagram illustrating the number of differentially enriched Hallmark gene sets with hypoxia (blue) or BAY treatment (purple). (E) Gene set enrichment results of hypoxia-treated cells. (F) Gene set enrichment results of BAY-treated cells. All gene sets listed were significantly enriched at FDR <0.05. NES, normalized enrichment score. (G) Volcano plot illustrating the results of a transcription factor enrichment analysis in hypoxia-treated cells. (H) Volcano plot illustrating the results of a transcription factor enrichment analysis in BAY-treated cells. (I) Venn diagram illustrating the overlap among enriched transcription factors following hypoxia or BAY treatment.
Figure 10—figure supplement 1—source data 1. Source data for Figure 10—figure supplement 1E.
Figure 10—figure supplement 1—source data 2. Source data for Figure 10—figure supplement 1F.
Figure 10—figure supplement 2. CDKN1A expression in BAY- and siPHD2-treated cells.
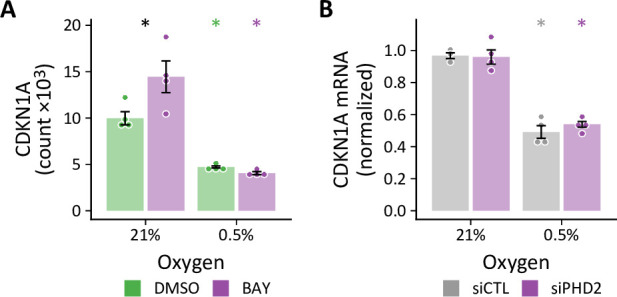
Figure 10—figure supplement 2.

(A) Normalized mRNA counts from RNA-seq analysis of LFs treated with hypoxia ±BAY (n=4). (B) Relative CDKN1A expression by RT-qPCR in siPHD2-treated in normoxia and hypoxia (n=4). Data are mean ± SEM (p<0.05 with black * indicating a significant effect of treatment within a given oxygen tension and colored * indicating a significant effect of oxygen for a given treatment as denoted by the color).