. 2023 Jul 10;12:e82597. doi: 10.7554/eLife.82597

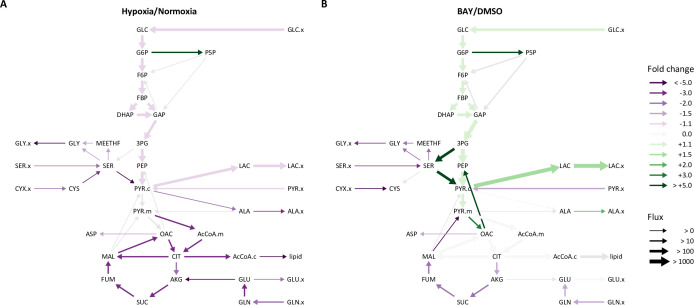
Figure 5. Metabolic flux analysis of lung fibroblasts following hypoxic and pharmacologic PHD inhibition.

(A) Ratio of modeled metabolic fluxes in 0.5% oxygen compared to 21% oxygen. Fluxes with non-overlapping confidence intervals are highlighted with arrows colored according to the magnitude of the fold change. Arrow thickness corresponds to the absolute flux measured in hypoxia. (B) Ratio of metabolic fluxes in BAY-treated cells compared to DMSO-treated control. Arrows are colored as in (A) and arrow weights correspond to the absolute flux as measured in BAY-treated cells.

Figure 5.

Figure 5—figure supplement 1. Isotope incorporation over the labeling time course.
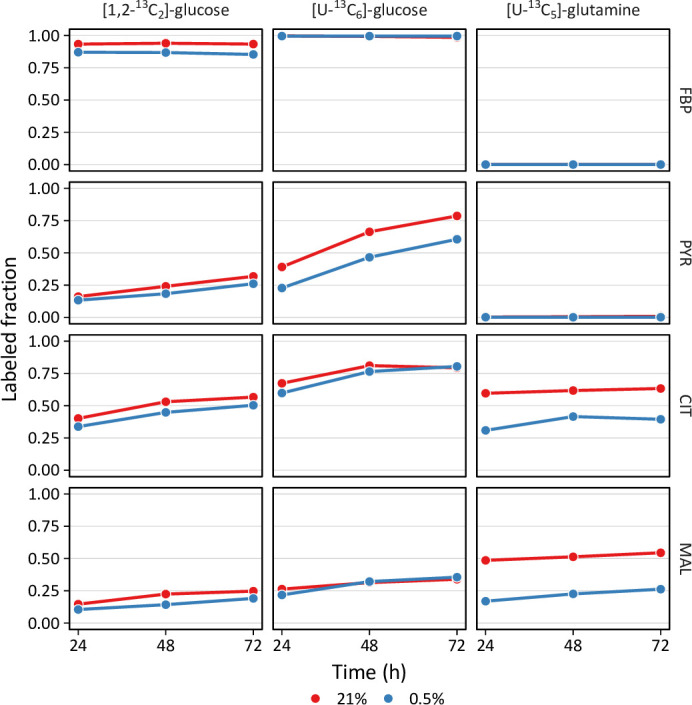
Figure 5—figure supplement 1.

LFs were cultured in 21% or 0.5% oxygen and labeled with the indicated tracers. Intracellular metabolites were analyzed by LC-MS (FBP, fructose-bisphosphate; PYR, pyruvate; CIT, citrate; MAL, malate). Mass isotopomer distributions were calculated and adjusted for natural abundance. Data show the total amount of metabolite labeling (i.e. 1 M0 fractional abundance). Data are the mean ± SEM of four biological replicates.
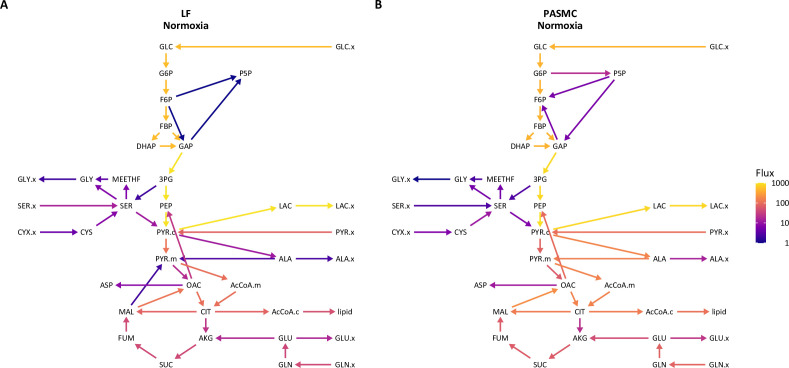
Figure 5—figure supplement 2. Isotopically non-stationary metabolic flux analysis of cell metabolism in 21% oxygen.

Figure 5—figure supplement 2.

(A) Metabolic flux model of LF metabolism in 21% oxygen. Arrows are colored by log10(flux). (B) Metabolic flux model of PASMC metabolism in 21% oxygen as in (A).
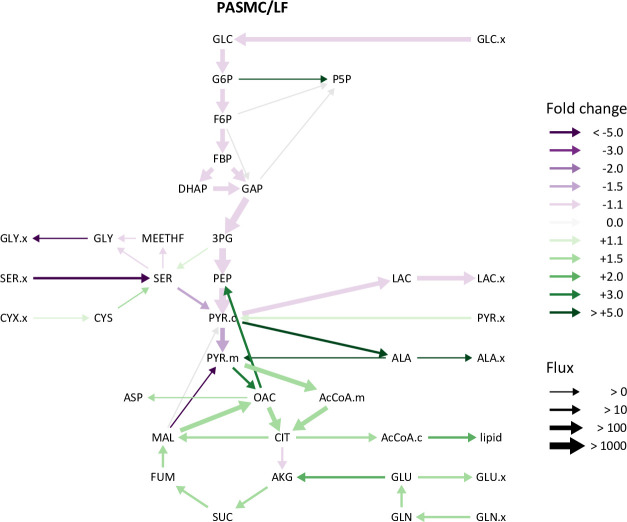
Figure 5—figure supplement 3. Comparison of lung fibroblast and pulmonary artery smooth muscle cell metabolic fluxes.

Figure 5—figure supplement 3.

Ratio of metabolic fluxes in PASMCs compared to LFs. Fluxes with non-overlapping confidence intervals are highlighted with arrows colored according to the magnitude of the change. Arrow thickness corresponds to the absolute flux measured in LFs.
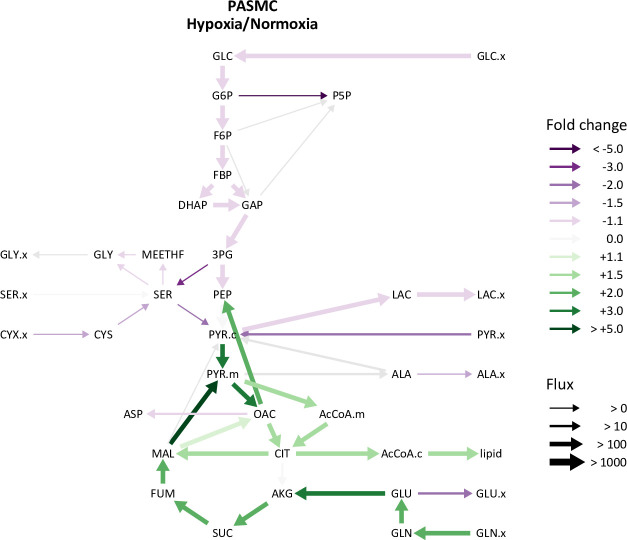
Figure 5—figure supplement 4. Comparison of pulmonary artery smooth muscle cell metabolic fluxes in 21% and 0.5% oxygen.

Figure 5—figure supplement 4.

Ratio of modeled metabolic fluxes in 0.5% oxygen compared to 21% oxygen. Fluxes with non-overlapping confidence intervals are highlighted with arrows colored according to the magnitude of the fold change. Arrow thickness corresponds to the absolute flux measured in hypoxia.
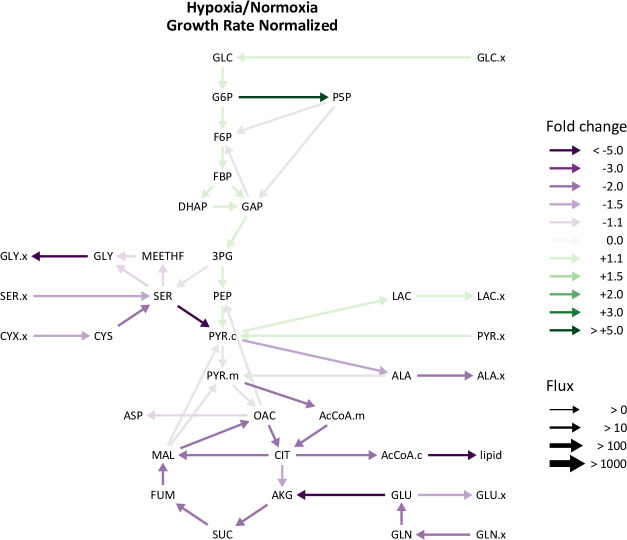
Figure 5—figure supplement 5. Growth rate adjusted changes in hypoxic lung fibroblast metabolism.

Figure 5—figure supplement 5.

LF fluxes were normalized to cell growth rate. Graph depicts the ratio of normalized metabolic fluxes in LFs cultured in 0.5% oxygen compared to 21% oxygen control. Fluxes with non-overlapping confidence intervals are highlighted to indicate significant changes.