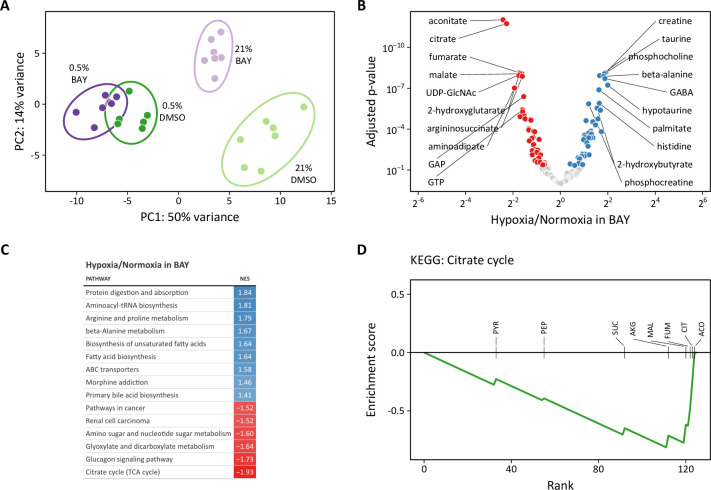
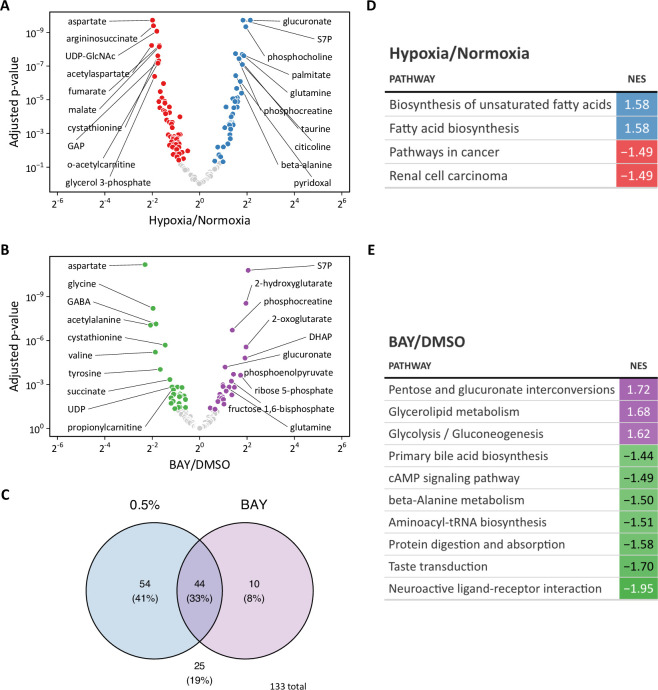
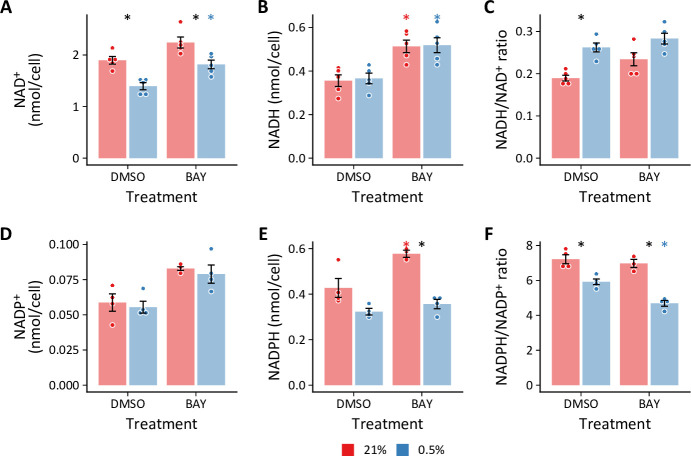
Figure 9. Metabolomic analysis of molidustat treatment in normoxia and hypoxia.
(A) Principal component analysis of intracellular metabolites following 72 hr of treatment suggests a dominant effect of hypoxia over pharmacologic PHD inhibition on the metabolome (n=7). (B) Volcano plot of intracellular metabolites of BAY-treated cells cultured in 21% or 0.5% oxygen. Filled circles indicate significantly increased (blue) and decreased (red) levels in hypoxia. (C) Metabolite set enrichment analysis of metabolites from (B). All KEGG pathways with p-values <0.05 are shown. (D) Leading edge analysis of the TCA cycle metabolite set. Negative values indicate the relative enrichment associated with BAY treatment alone compared to BAY plus hypoxia treatment. Abbreviations: PYR, pyruvate; SUC, succinate; PEP, phosphoenolpyruvate; CIT, citrate; AKG, α-ketoglutarate; MAL, malate; ACO, aconitate; FUM, fumarate.


