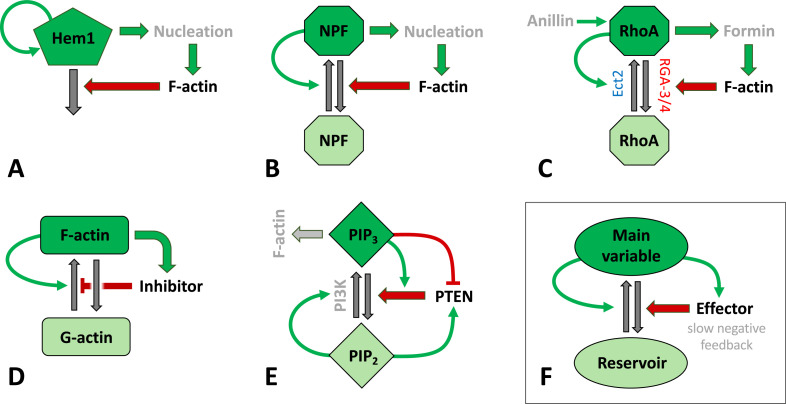
Figure 3. Schematic representation of signaling mechanisms for actin waves identified in various species and included in many models.
Green (red) arrows correspond to positive (negative) feedback signaling (red arrows promote inactivation in A–C, E–F or inhibit actin assembly in D). Black arrows represent interconversions, and dark (light) colors of shapes correspond to active (inactive) forms of signaling agents. (A) The Hem1 complex was identified as a central component in neutrophils as modeled in Weiner et al., 2007. (B) A generic model for actin waves based on the interactions of F-actin with a nucleation promoting factor (NPF) (Doubrovinski and Kruse, 2011; Dreher et al., 2014; Holmes et al., 2012; Mata et al., 2013). A similar filament model by Carlsson, 2010 left out the autocatalysis and failed to produce well-structured waves. (C) The assembly of F-actin by the formin mDia was investigated in embryos of C. elegans (Michaux et al., 2018), where RGA3/4 was identified as the GAP. In oocytes of Xenopus and starfish, Ect2 was found to be the GEF, and RGA3/4 is recruited by F-actin (Bement et al., 2015; Goryachev et al., 2016; Michaud et al., 2021). The circuit was modeled in Goryachev et al., 2016. (D) A model for F- and G-actin and a polymerization inhibitor was proposed by Yochelis et al., 2020; Yochelis et al., 2022. There are also similar, yet more detailed versions, that identified coronin as the inhibitor (Wasnik and Mukhopadhyay, 2014) or that incorporated cortical actin/stress fibers (Bernitt et al., 2017). (E) A slightly distinct model structure for phosphoinositides and PTEN as proposed in Shibata et al., 2012. (F) Essential structure of models (A–D): The key variable is autocatalytic and promotes an effector that exerts at least one (slow) negative feedback. The circuits have been drawn to emphasize similarities in the structures and connectivities. In (B–D), the total amount of the main agent (RhoA, GTPase, or actin) was assumed to be constant.

