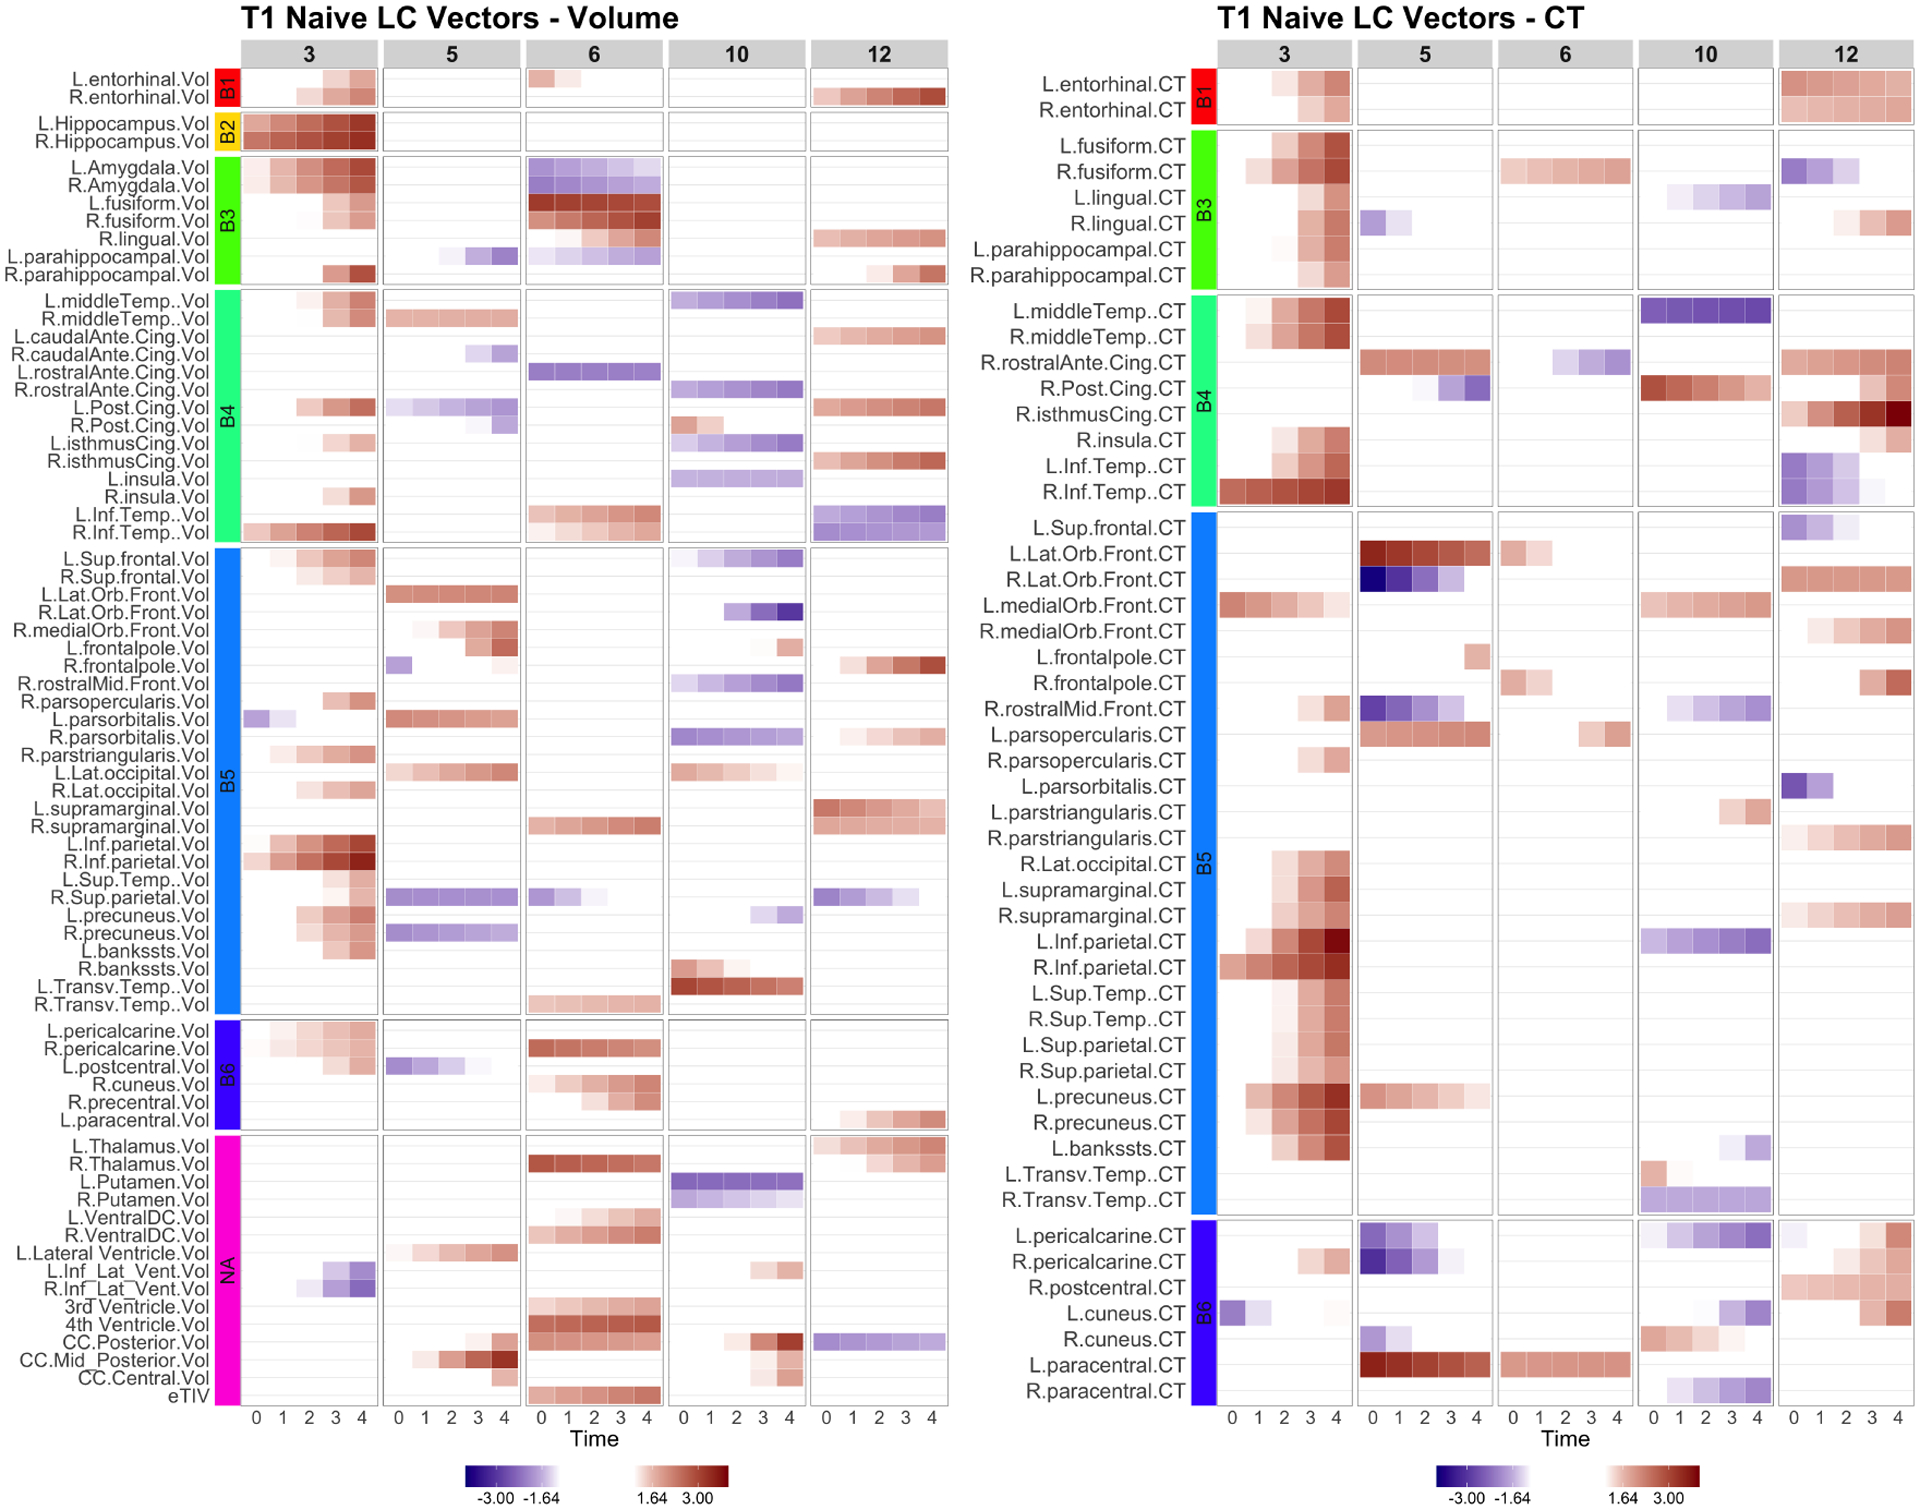
Fig. 4.

Naive: the longitudinal canonical vectors for T1 are displayed at . We separately present the LC vectors by volumetric (Vol) and cortical thickness (CT) measures. The rows were sorted by the Braak staging (B1-B6, NA). The Naive LCV 3 represents a global longitudinal patterns in volumes and cortical thickness.
