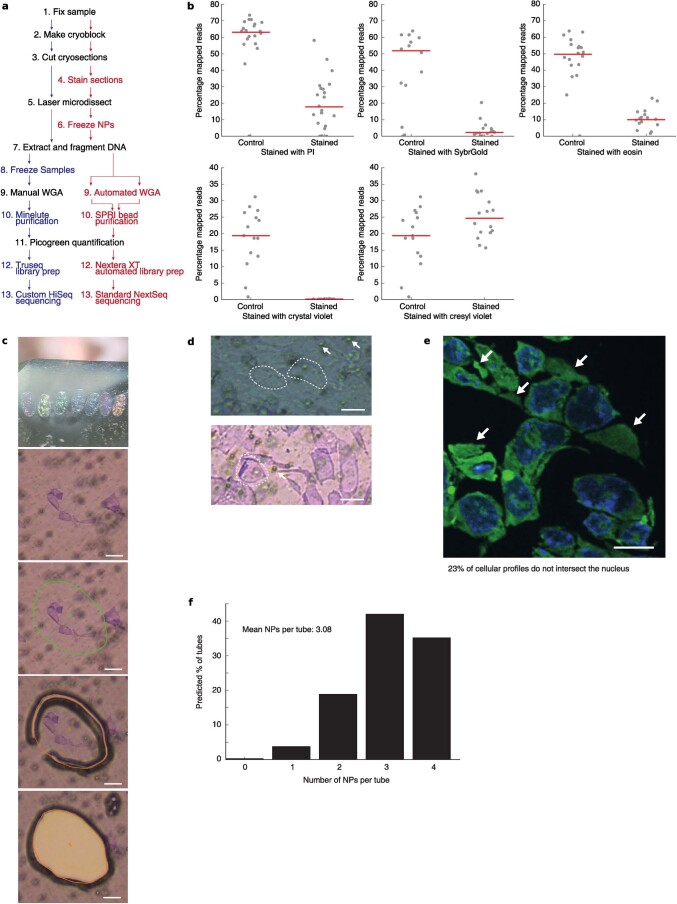
Extended Data Fig. 4. Optimizations to the GAM protocol.
a, Comparison of the original (black and blue lettering) and multiplex (black and red lettering) GAM protocols. WGA: Whole Genome Amplification. b, Effect of various staining protocols on downstream DNA extraction. Top row: propidium iodide (n=21 each), SYBR® Gold (n=16 stained; 14 unstained) and Eosin (n=16 stained; 19 unstained); bottom row: crystal violet (n=16 stained; 15 unstained) and cresyl violet (n=16 stained; unstained the same as for crystal violet). Red lines indicate the median percentage of mapped reads per GAM-3NP sample. c, Top panel: cryosection thickness can be identified from the section’s color. Bottom panels: cresyl violet staining improves the visualization of NPs during laser microdissection. Scale bar 10μm. d, Top: unstained cryosections from mES cells. Individual NPs are outlined by dashed white lines. White arrows indicate typical background (air bubbles) in the microdissection membrane. Bottom: Cresyl violet stains both cytoplasm and nucleoplasm in mES cell cryosections as visualized by brightfield microscopy, and therefore does not distinguish cellular profiles that intersect the nucleus. Scale bar 10μm. e, Example mES cell cryosection visualized by confocal fluorescence microscopy. DNA stained with DAPI is shown in blue and RNA stained with SYTO® RNASelect dye is shown in green. White arrows indicate cellular profiles that do not intersect nuclei (n=647 profiles intersect the nucleus of 857 profiles analyzed; Supplementary Table 10). Scale bar 10μm. f, Binomial distribution showing the expected number of profiles per GAM sample that intersect nuclei across a collection of samples each with four cellular profiles.

