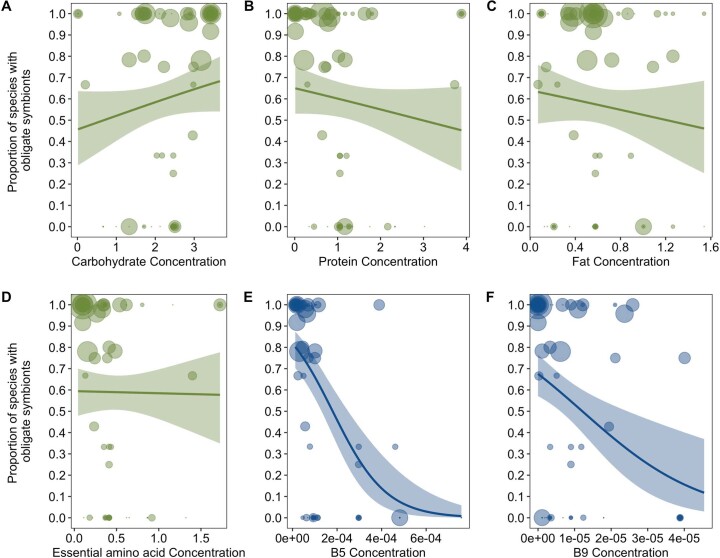
Extended Data Fig. 9. The evolution of obligate symbioses in relation to nutrient deficiencies after restricting data to families where obligate symbioses had been directly studied.
The proportion of species with obligate symbionts in families is plotted in relation to dietary concentrations of (A) Carbohydrate, (B) Protein, (C) Fat (D) Essential Amino Acids, (E) Vitamin B5 and (F) vitamin B9. Obligate symbioses was negatively phylogenetically correlated to concentrations of B vitamins (B phylo r (CI) = −0.58 (−0.79, −0.04), pMCMC = 0.05. Supplementary Table 25). Values of macro- and micro-nutrients are standardized amounts per gram (‘Nutrient data’ in Methods). The size of points represents the mean number of host species (log transformed) examined for obligate symbionts per family. Lines represent logistic regressions with 95% confidence intervals (shaded bands) plotted for illustrative purposes.

