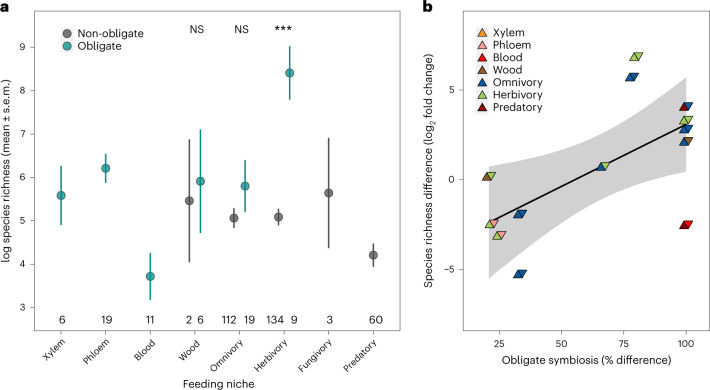
Fig. 4. Obligate symbioses and the evolutionary potential for diversification.
a, Diversification was measured as the number of species within families presented on a natural logarithmic scale (mean ± s.e.m.). BPMMs were used to test if the species richness of each feeding niche was significantly higher or lower than the average of all other niches (*pMCMC <0.05, **pMCMC <0.01, ***pMCMC <0.0001. Exact pMCMC values are given in Supplementary Table 17), and if families with (>50%) and without (<50%) obligate symbionts feeding within the same niche had higher or lower species richness (Supplementary Table 17). BPMMs controlled for differences in family age, holo- and hemi-metabolism and insect phylogenetic history. The number of insect families are given along the x axis. b, Sister lineage comparisons showing families with a higher percentage of species with obligate symbionts are associated with greater species richness (y axis: log2 fold change: 0, no difference; 1, double the number of species; −1, half the number of species; Extended Data Fig. 6 shows differences in absolute numbers of species). Details of the taxa involved in sister comparisons are presented in Supplementary Table 29. Symbols are coloured by the feeding niches of the sister families, with colours on the left indicating the feeding niche of the family with the lowest rates of obligate symbiosis and the highest on the right. Regression line with 95% confidence intervals (shaded band) plotted for illustrative purposes. NS, not significant.

