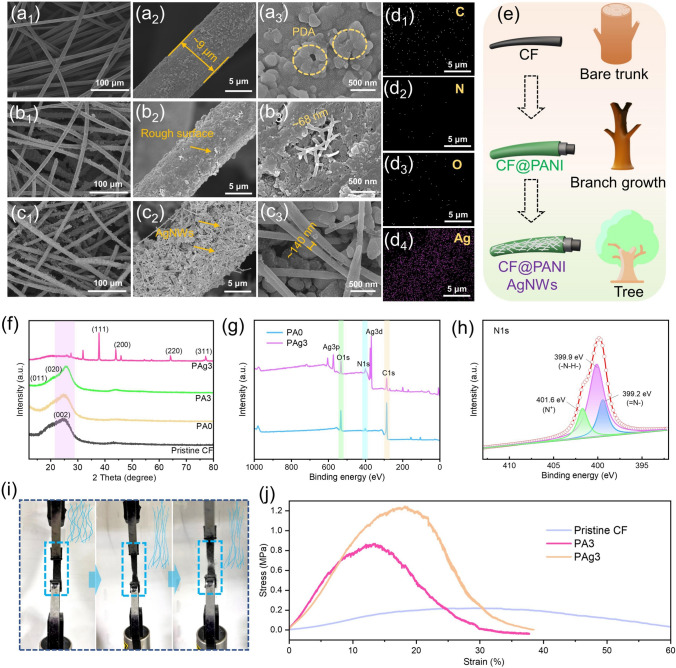
Fig. 2.
SEM images with different resolutions of a PA0, b PA3, c PAg3. d EDS mapping of PAg3, including the elements of C, N, O, and Ag. e Illustration of the branch-trunk interlocked structure of the PAg3. f XRD spectra of the prepared samples. g The total XPS spectra of PA0 and PAg3. h N 1s XPS spectrum of PAg3. i Mechanical tensile processes of the sample (the inserted blue lines represent the changes of carbon fibers during stretching). j Strain–stress curves of the different samples

