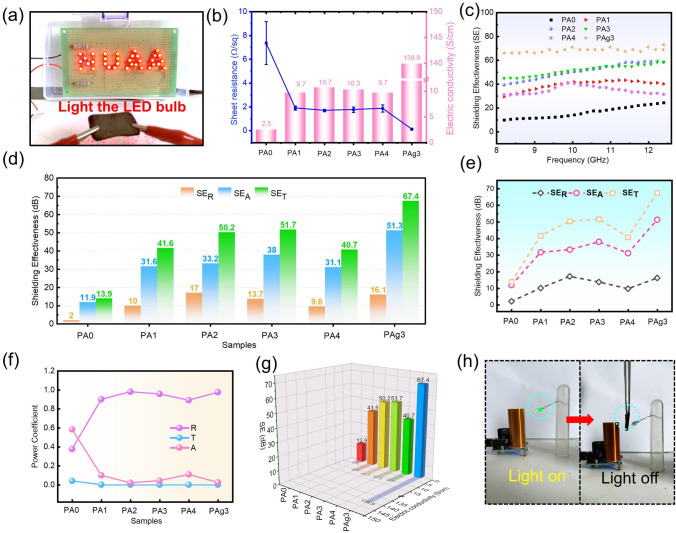
Fig. 3.
a Digital of PAg3 in closed circuits, and the LED bulb could be lighted up. b Square resistance and corresponding electric conductivity of the samples. c EMI shielding properties of the different samples. d, e Proportion of SEA, SER, and SET of the samples at 10 GHz. f Power coefficients of the samples, including A, R, and T. g Relationship between EMI shielding property and electric conductivity of the samples at 10 GHz. h Photograph of Tesla coil used to show EMI shielding performance of PAg3

