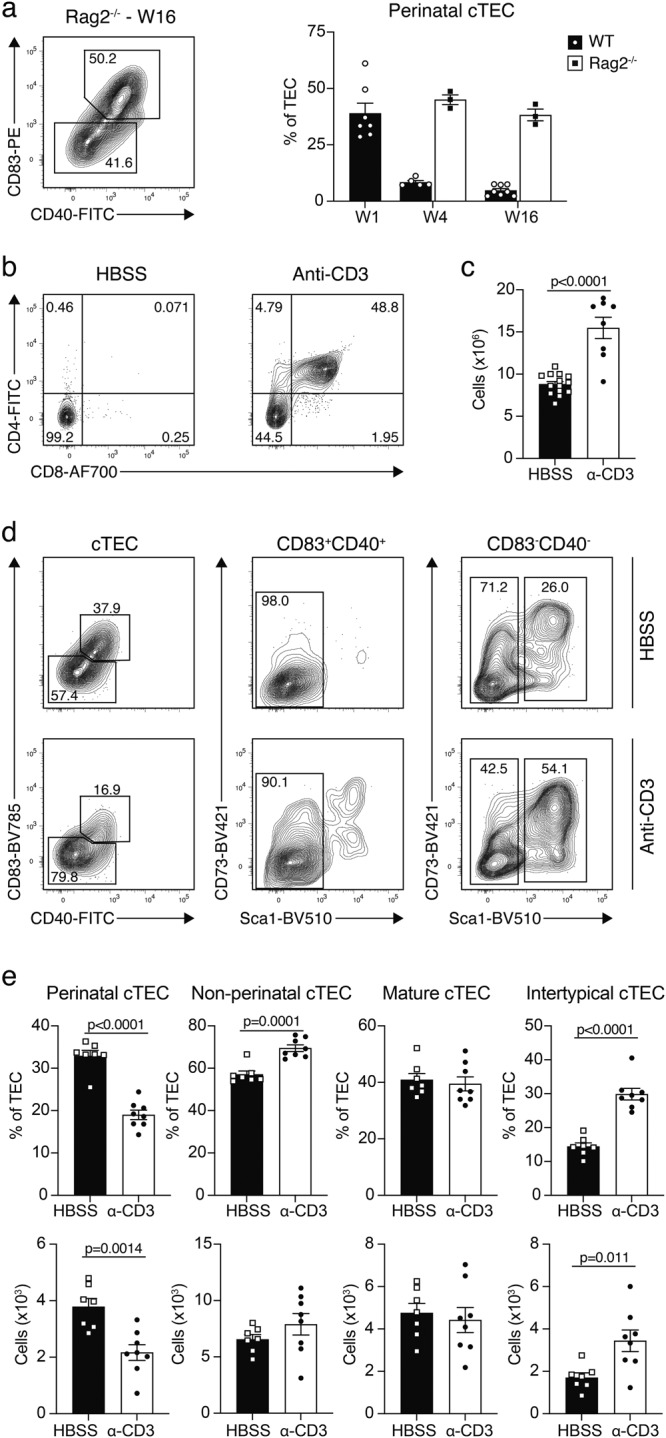
Fig. 7. Crosstalk with thymocytes facilitates cTEC maturation.

(a) Rag2−/− mice were analysed for the abundance of perinatal cTEC at 4- and 16-weeks and compared to perinatal cTEC in 1-, 4-, and 16-week-old C57BL/6 WT mice. Shown are a representative FACS plots and cumulative data (W1 n = 7, W4 WT n = 5 and Rag2−/− n = 3, W16 WT n = 8 and Rag2−/− n = 3). Data shown are derived from one out of two independent experiments. Data are presented as mean values +/− SEM. Source data are provided as a Source Data file. b, c Rag2−/−- mice were injected with HBSS or α-CD3 antibodies (clone KT3) and analysed four weeks later for the development of double positive thymocytes. Shown are (b) representative FACS plots depicting the emergence of CD4+CD8+ cells and (c) cumulative data for the total number of cells per thymus (HBSS n = 14, α-CD3 n = 8, from two independent experiments). Data are presented as mean values +/− SEM. Source data are provided as a Source Data file. d, e The cTEC compartment was analysed for changes in the abundance of cTEC subpopulations (CD83+CD40+Sca1− perinatal, CD83−CD40− non-perinatal, CD83−CD40−Sca1− mature, and CD83−CD40−Sca1+ intertypical cTEC) following α-CD3 treatment. Shown are (d) representative FACS plots and (e) cumulative data as percentage of TEC and as total cell numbers (HBSS n = 7, α-CD3 n = 8, from two impendent experiments). Data are presented as mean values +/− SEM. Statistical analysis was done using a two-tailed unpaired Student’s t-test. Source data are provided as a Source Data file.
