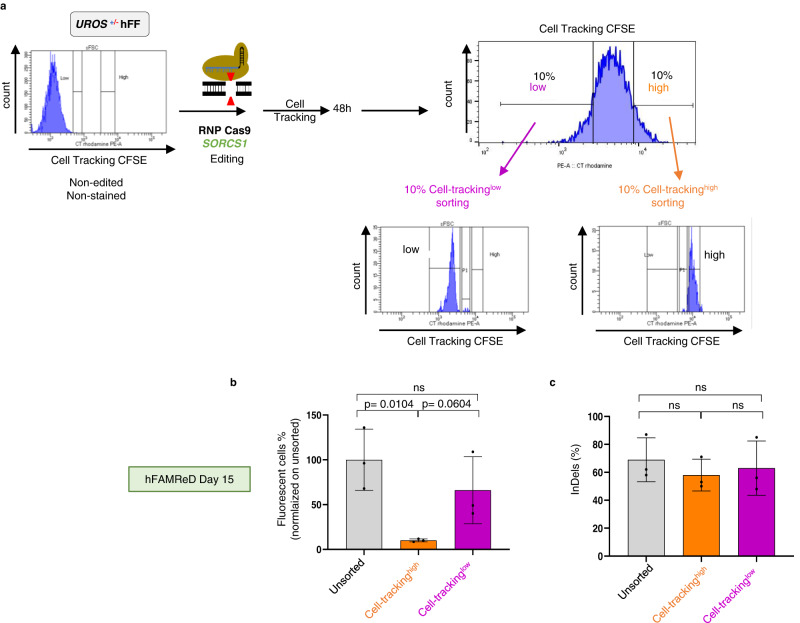
Fig. 7. Low cell proliferation mitigates CRISPR-induced LOH frequency.
a hFFs edited and stained with a fluorescent cell tracker. 48 h after editing, the 10% of cells with the highest MFI (“cell tracking high” cells, orange) and the 10% of cells with the lowest MFI (“cell tracking low” cells, purple) were sorted by FACS. b, After day 14, fluorescent cells revealing LOH are analyzed by flow cytometry in each cell fraction (mean ± SD, n = 3 independent experiments). c InDels were quantified by sequencing and ICE analysis in each cell fraction (n = 3 independent experiments, mean ± SD). Anova test used to compare multiple groups, Mann–Whitney or t test to compare two groups (two-sided). Source data are provided as a Source Data file.

