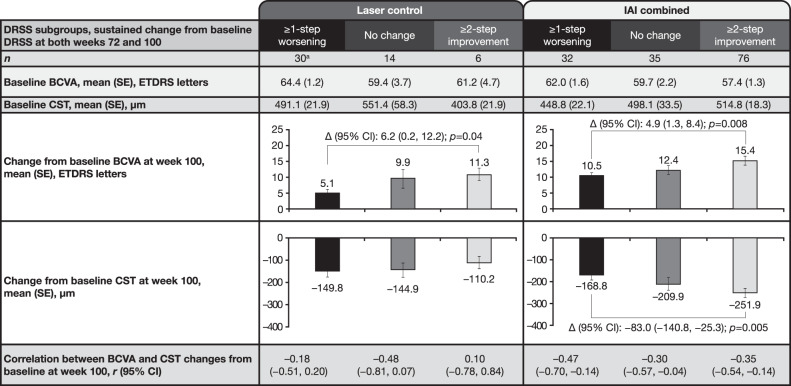
Fig. 4. Change from baseline in BCVA and CST by treatment and sustained DRSS subgroups at week 100.
aOne patient did not have CST data at week 100. Observed cases. Full analysis set. Data from rescued patients were censored after rescue. Patients who did not have available BCVA at week 100 were excluded. BCVA best-corrected visual acuity, CST central subfield thickness, DRSS Diabetic Retinopathy Severity Scale, IAI intravitreal aflibercept injection, ETDRS Early Treatment Diabetic Retinopathy Study, Δ difference.

