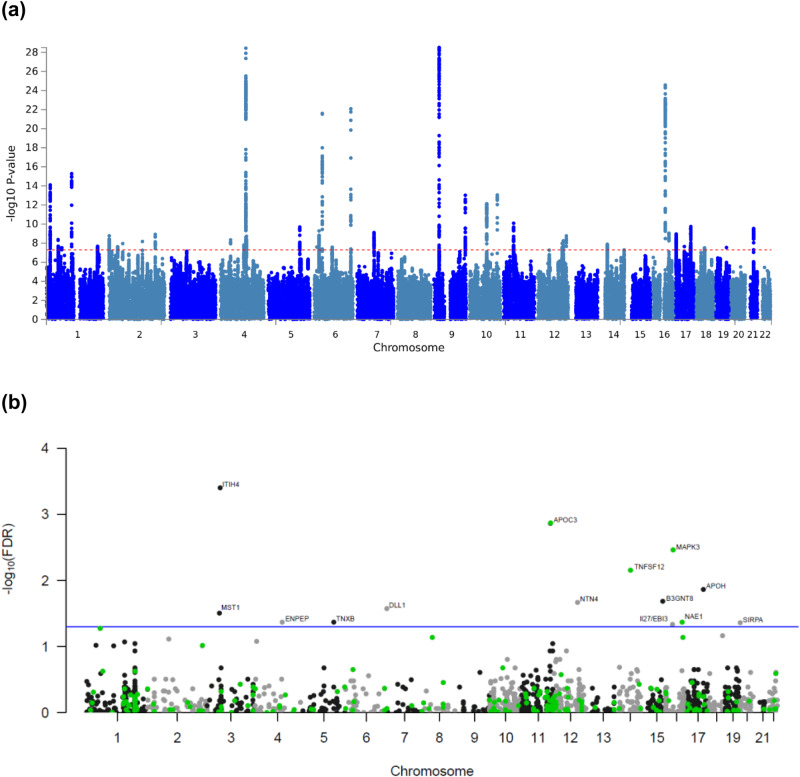
Fig. 2. Manhattan plots showing associations with HF from a GWAS meta-analysis on n = 1,266,315 individuals and b MR-wide proteomics.
a Manhattan plot showing the −log10(P value) of association for each SNP from the GWAS meta-analysis plotted on the y-axis against genomic position on the x-axis. The red dotted line corresponds to the genome-wide significance threshold. The summary statistics of independent lead SNPs are noted in Supplementary Data 1. b Manhattan plot showing the −log10-transformed FDR-adjusted P value of association for each gene plotted against genomic position on the x-axis. All tests were two-sided and adjusted for multiple comparisons. The blue line corresponds to an FDR threshold of 5% and points are color-coded by drug tractability information based on data provided by OpenTargets; green for druggable genes. FDR false discovery rate.

