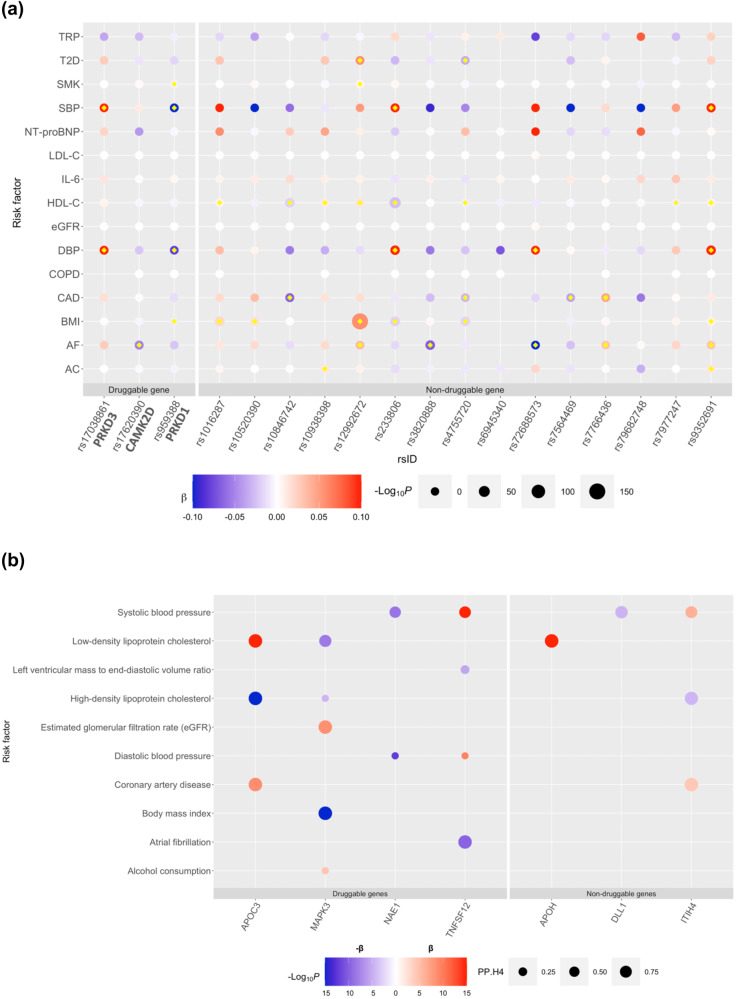
Fig. 3. Plots showing a genetic association of 18 HF loci against risk factors for HF and b MR and colocalization estimates of MR-proteomic genes-hits against HF risk factors.
a The color of the bubble corresponds to the beta coefficient of the genetic association between the loci (x-axis) and trait (y-axis). Blue corresponds to a negative and red corresponds to a positive beta coefficient. The size of each bubble corresponds to the negative logarithm of the association p value; larger size corresponds to lower p values. Loci are grouped by druggable and non-druggable genes. All tests were two-sided without adjustment for multiple comparisons. Associations which passed the p value threshold (p < 1 × 10⁻⁴) are denoted by a yellow diamond. b This bubble plot shows MR estimates for which p < 1 × 10⁻⁴. The size of each bubble corresponds to the posterior probability for hypothesis 4 derived from colocalization. The color of the bubble corresponds to the beta coefficient derived from MR. Blue corresponds to a negative association and red corresponds to a positive association; note that a positive indicates either an increase in protein levels corresponding to an increase in HF risk or a decrease in protein levels corresponding to a decrease in HF risk, while a negative indicates either a decrease in protein levels corresponding to an increase in HF risk or an increase in protein levels corresponding to a decrease in HF risk. The intensity of the color corresponds to −log10(P value) for the strength of association in the MR. All tests were two-sided without adjustment for multiple comparisons. Loci are grouped by druggable and non-druggable genes. TNXB, SIRPA, and ENPEP genes are not included as these had no MR estimates on HF risk factors that pass the p < 1 × 10⁻⁴ threshold. , Beta coefficient, AC alcohol consumption, AF atrial fibrillation, BMI body mass index, CAD coronary artery disease, COPD chronic obstructive pulmonary disease, DBP diastolic blood pressure, eGFR estimated glomerular filtration rate, HDL-C high-density lipoprotein cholesterol, IL-6 Interleukin-6, LDL-C low-density lipoprotein cholesterol, NT-proBNP N-terminal proBNP, SBP systolic blood pressure, SMK smoking, T2D type-2 diabetes, TRP troponin I cardiac muscle, PP.H4 posterior probability of H4.

