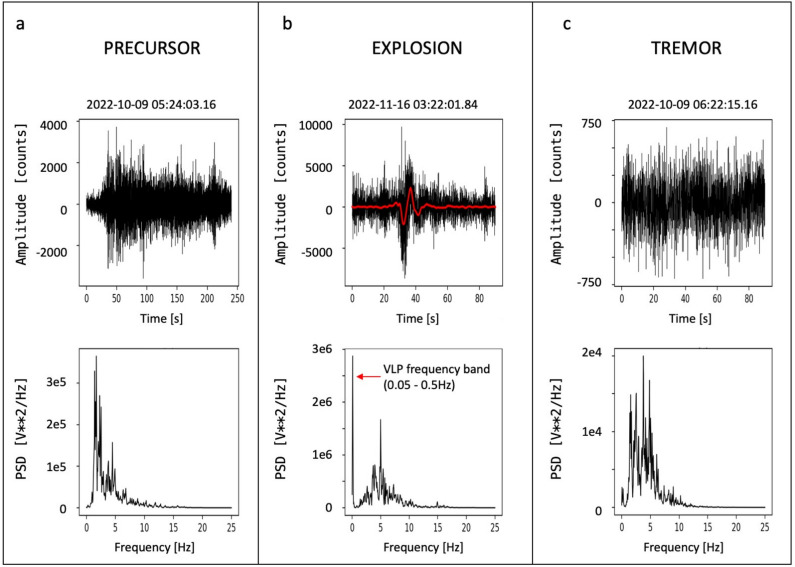
Figure 5.
Comparison between the spectral content of the seismic precursor of the October 9 2022 episode (a) and a signal generated by an explosion (b). Panel (a) shows the seismogram and power spectral density of the seismic precursor onset. Panel (b) shows the seismogram and power spectral density of the explosion signal. Note the peak due to the VLP component. The filtered signal in the VLP band (0.05–0.5 Hz) is shown in red on the seismogram. Panel (c) shows the seismogram and power spectral density of the tremor recording.

