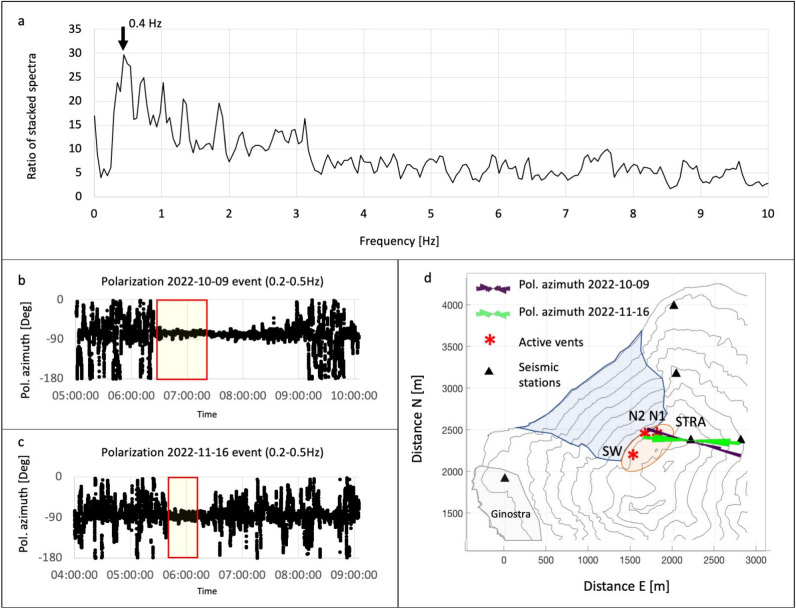
Figure 6.
(a) Ratio of stacked spectra of seismic precursor (15 windows of 1-minute length) and tremor (20 windows of 1-minute length). The maximum of the stacked spectra ratio corresponds to the 0.4 Hz frequency. (b) Azimuth of the seismic signal polarization of the STRA station in the frequency band 0.2–0.5 Hz, relevant for the overflow episode of 9 October 2022 (from 5:00 to 10:00). The rectangle with the red border highlights the segment used for the rose diagram of panel d (purple rose). (c) Azimuth of the seismic signal polarization of the STRA station in the 0.2-0.5 Hz frequency band, related to the overflow episode of 16 November 2022 (from 4:00 to 9:00). The rectangle with the red border highlights the segment used for the rose diagram of panel d (green rose). (d) Rose diagrams of the polarization azimuth of the two overflow episodes superimposed on the Stromboli map. The positions of the STRA station and the active vents are shown on the map. The thermal precursor is located on vent N2.

