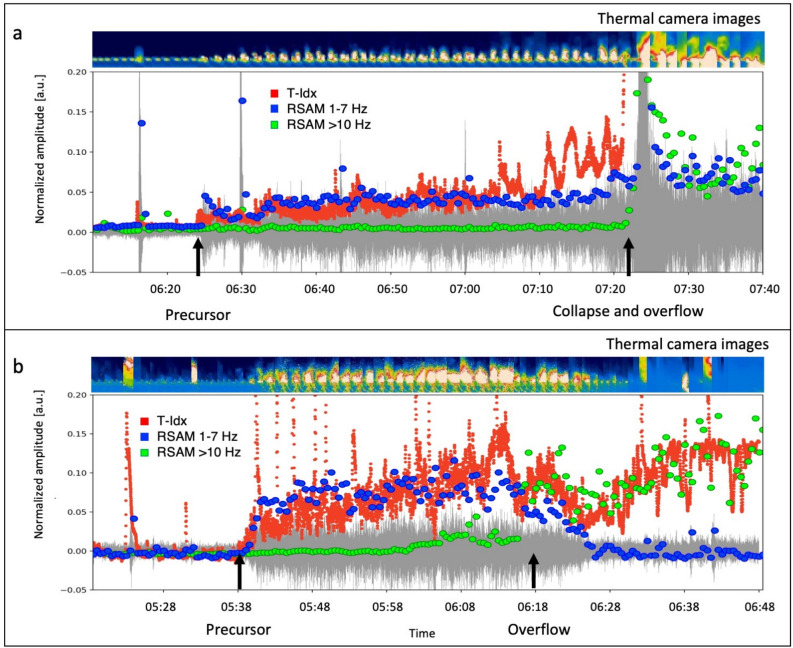
Figure 7.
Comparison of seismic parameters with the T-Idx for the overflow on October 9, start time 06:10:00.00 UTC (a) and November 16, start time 05:24:00.00 UTC (b). The green dots represent the seismic amplitude in the Hz band, the blue dots the seismic amplitude in the 1–7 Hz band and the red dots indicate the T-Idx. For both panels, the seismogram is shown in grey in the background. A sequence of images from the thermal camera, which provides a visual representation of the phenomenon, is shown at the top of each panel.

