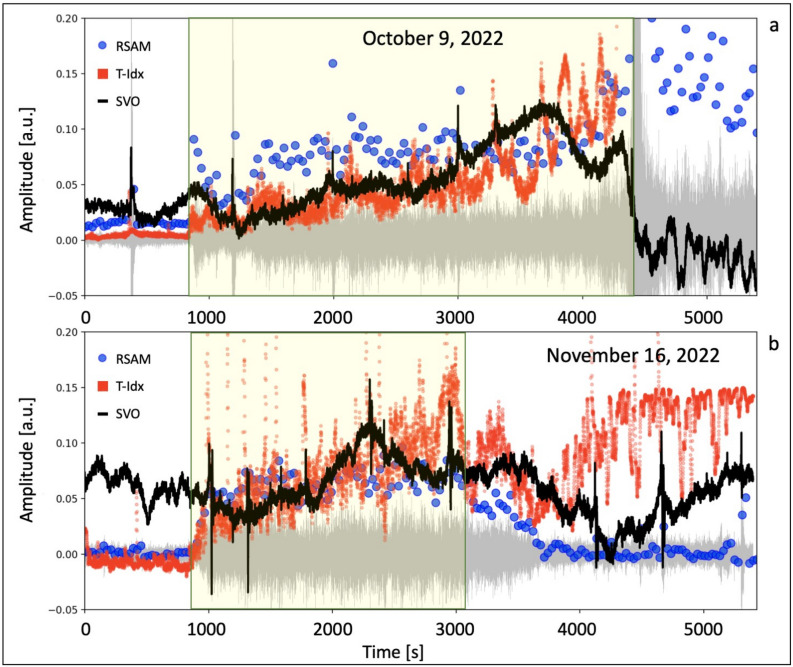
Figure 9.
Comparison between the seismic precursor (RSAM of the northern component signal of the STRC station, filtered in the 1–7 Hz frequency band) indicated by the blue dots, the T-Idx temperature index, marked by the red dots, and the SVO strainmeter signal (black line), filtered in the 0.00014–0.5 Hz frequency band, for the overflow on October 9 (a) and November 16 (b), 2022. The yellow rectangles indicate the time intervals between the onset of the seismic and thermal precursors and the onset of the overflows. These timeslots are 58 min, starting at 06:24 UTC and 40 min, starting at 05:38 UTC, for the events on October 9 and November 16, 2022, respectively. The amplitudes are normalized with the addition of appropriate offsets for the legibility of the graph.

