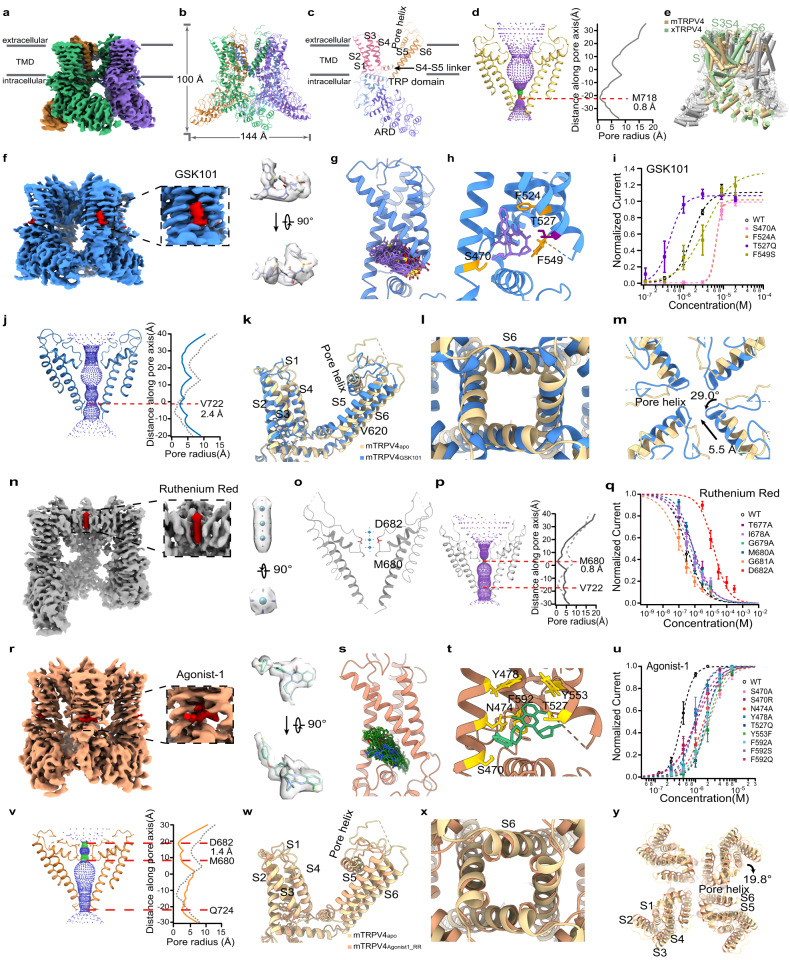
Fig. 1. Structures of mouse TRPV4 in the apo and ligand bound states.
a 3D reconstruction of mTRPV4apo with each subunit individually colored. The gray bars define the position of the cell membrane. b Cartoon representation of mTRPV4apo with each subunit individually colored. c Cartoon representation of one subunit of mTRPV4apo with domains colored in a rainbow. d Profile of pore radii in mTRPV4apo. The region in red is too narrow to allow a water molecule to pass. e Cylinder representation of mTRPV4 compared to xTRPV4 in the apo state. f 3D reconstruction of mTRPV4GSK101.The electron density of a GSK101 molecule is highlighted in red. g Ensemble plot of the GSK101 molecule in the cavity formed between S1 to S4 of mTRPV4 in all-atom MD simulations. h GSK101 inside mTRPV4, with the labeling of key residues in the binding sites. i Concentration-response curves of GSK101 activation in WT mTRPV4 and mutants (n = 3–8 cells). Data were presented as mean ± s.e.m. j Profile of pore radii in mTRPV4GSK101 compared with mTRPV4apo. k Side view of conformational changes of mTRPV4GSK101 compared with mTRPV4apo. Only one subunit was shown for clarity. l Bottom view from the intracellular side of conformational changes of mTRPV4GSK101 compared with mTRPV4apo. m Top view from the extracellular side of conformational changes of mTRPV4GSK101 compared with mTRPV4apo. n 3D reconstruction of mTRPV4GSK101_RR. The electron density of a Ruthenium Red molecule is highlighted in red. o Cartoon representation of Ruthenium Red in mTRPV4. Key residues close to Ruthenium Red are shown. p Profile of pore radii in mTRPV4GSK101_RR. q Concentration-response curves of Ruthenium Red inhibition in WT TRPV4 and mutants (n = 3–4 cells). Data were presented as mean ± s.e.m. r The electron density of an Agonist-1 molecule is highlighted in red. s Ensemble plot of the Agonist-1 molecule in the binding pocket formed between S1 to S4 of mTRPV4 in all-atom MD simulations. t Cartoon representation of Agonist-1 in mTRPV4. Key residues close to Ruthenium Red are shown. u Concentration-response curves of Agonist-1 activation in WT TRPV4 and mutants (n = 3–4 cells). Data were presented as mean ± s.e.m. v Profile of pore radii in mTRPV4Agonist1_RR. w Side view of the conformational changes of mTRPV4Agonist1_RR compared with mTRPV4apo. Only one subunit was shown for clarity. x Bottom view from the intracellular side of mTRPV4Agonist1_RR compared with mTRPV4apo. y Top view from the extracellular side of the conformational changes of mTRPV4Agonist1_RR compared with mTRPV4apo.

