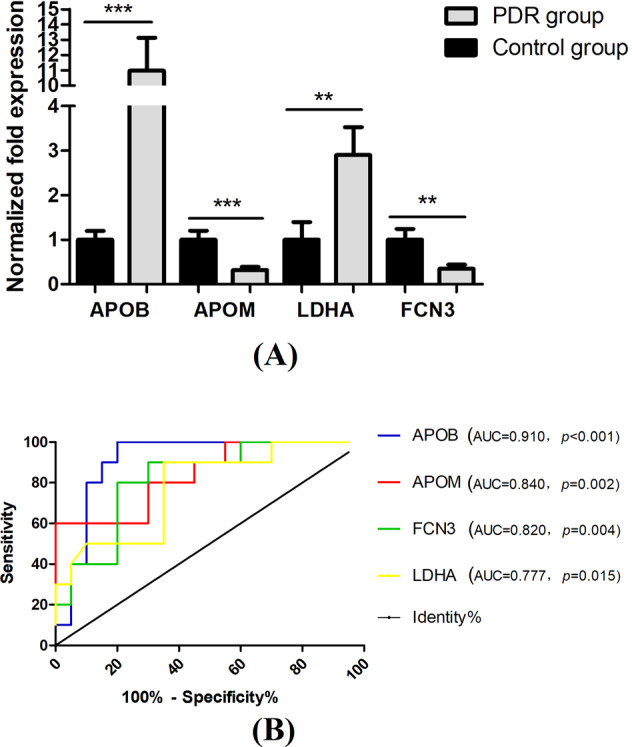
Fig. 4. Parallel reaction monitoring (PRM) analysis of the differentially expressed exosome proteins.

LDHA, FCN3, ApoB and ApoM showed a consistent trend with the results of proteomics analysis. **<0.01, ***<0.001 (A). Receiver operating characteristic (ROC) curve assay of these verified exosome proteins as diagnostic biomarkers (B).
