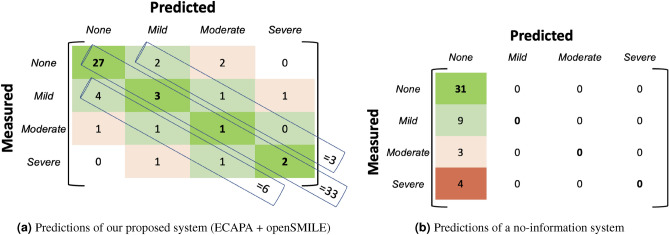
Figure 5.
Confusion matrix obtained by considering predicted depression severity scores (PHQ-8) by (a) our proposed system—LSTM model trained combining ECAPA-TDNN with OpenSMILE features, and (b) a no-information system which predicts the mean value for every input. Fine grained clinical levels of the predicted depression severity scores obtained by dividing the depression severity scores into 4 different groups: None (PHQ-8<= 8); Mild (PHQ-8 range 9–12), Moderate (PHQ-8 range 13–16) and Severe (PHQ-8 range 17–24).

