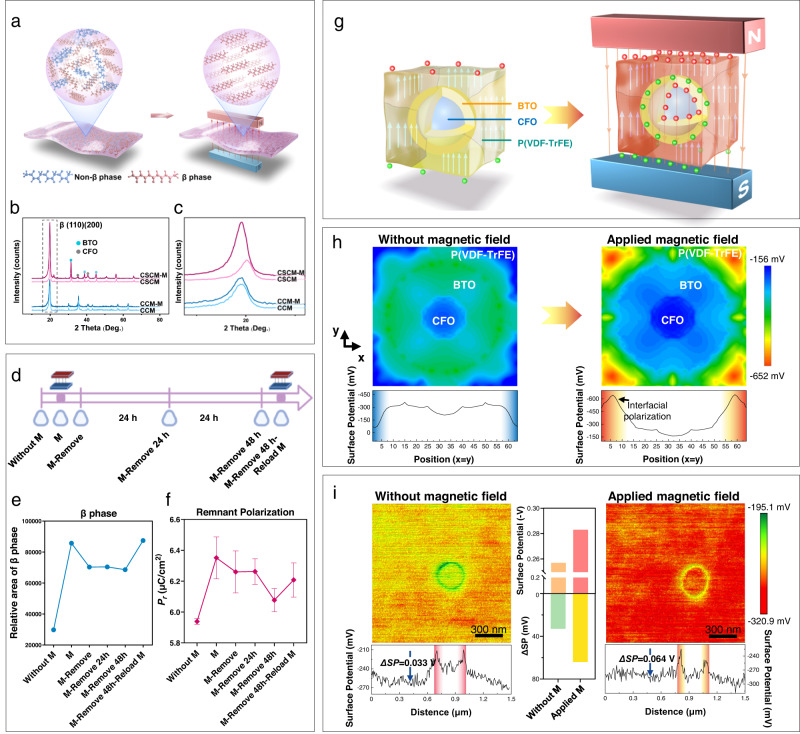
Fig. 3. Mechanisms of how magnetic field enhances polarization by phase transition and interfacial polarization.
a Schematic illustration of phase transition. b XRD results of CSCM and CCM, with or without exposure to the external magnetic field. c Enlarged image of β-phase change of XRD results. d Schematic diagram of the time points for detection of XRD and residual polarization intensity. Created with BioRender.com. e The semi-quantitative relative area of β-phase change, according to the loaded conditions of the external magnetic field. f The residual polarization intensity (Pr) of CSCM was changed according to the loaded conditions of the external magnetic field. (n = 5 independent membrane samples; mean ± SEM) g Schematic diagram of interface polarization. h Phase-field simulation of surface potential change before and after magnetic field exposure. The surface potential values along the diagonal represent the interfacial polarization with the addition of a magnetic field. i Without (left) and with (right) magnetic field loading, the SKPM images of interface polarization and relative surface potential. Comparison of mean values of the surface potential within the detection range (scan size = 1.5 μm) and ΔSP, which represents the difference of surface potential between the interface and the matrix (ΔSP = SPInterface - SPMatrix). Source data are provided as a Source Data file.

