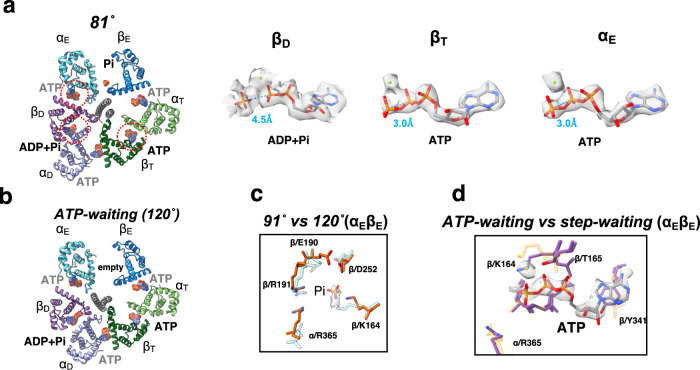
Fig. 4. Structures captured at low [ATP].
a Cross section of the F1 domain in 81° showing the catalytic sites viewed from the Fo side. The bound nucleotides are represented as spheres. The electron density of the nucleotides within the enclosed circles are shown in larger view on the right. The distance between γ (or Pi) and β phosphate of the ATP in each conformational state is shown in blue (Å). Each distance was calculated using Chimera software. b Cross section of the F1 domain in ATP-waiting (120°). c Comparison of the Pi binding site in αEβE in the 91° and 120° structures with electron density indicated for the Pi. d Comparison of the catalytic site of the αEβE in ATP waiting (cream) and step waiting (purple). ATP in step waiting is represented by the orange and blue sticks. The step waiting structure was captured at high [ATP].

