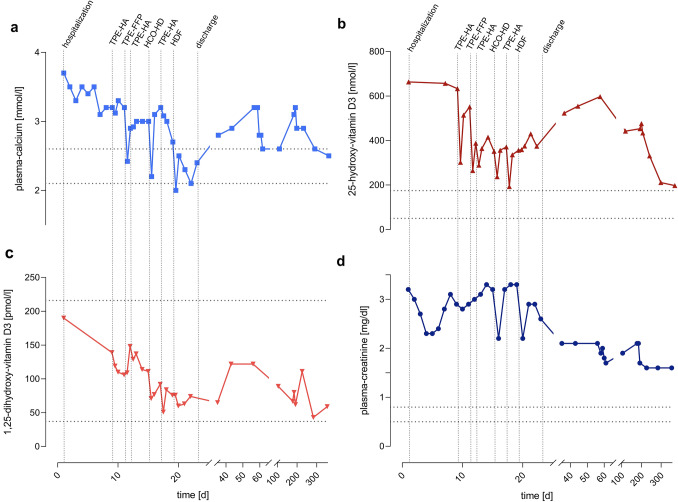
Fig. 1.
Time course of plasma concentrations of calcium (a), 25-OH-vitamin D3 (b), 1,25-OH-vitamin D3 (c) and creatinine (d) of patient 1. Hospital admission, discharge and extracorporeal treatments are marked with vertical dotted lines. Normal ranges are marked with horizontal dotted lines. HDF hemodiafiltration, HCO–HD high cut-off hemodialysis, TPE-FFP total plasma exchange with replacement by fresh frozen plasma, TPE-HA total plasma exchange with replacement by human albumin

