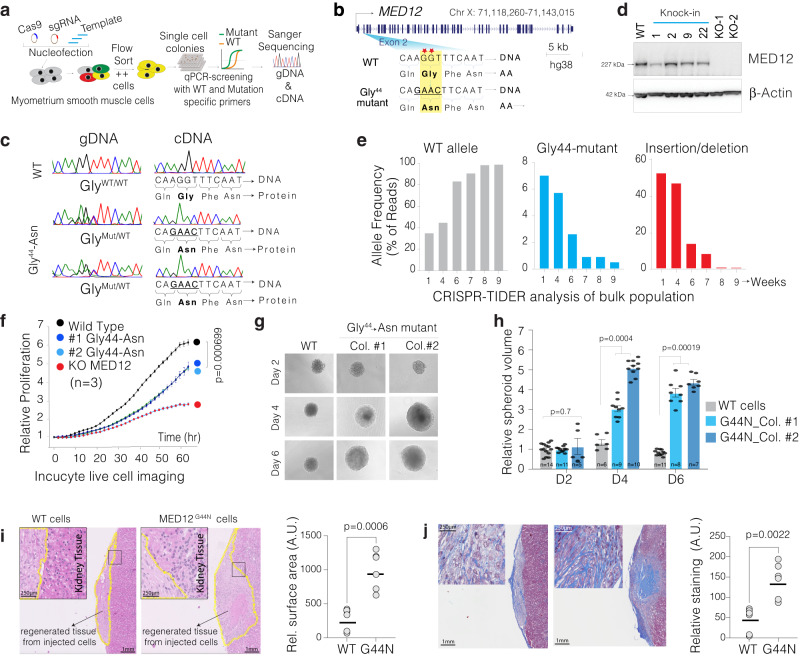
Fig. 1. CRISPR-engineered recurrent MED12 Gly-44 mutation results in aberrant cell proliferation.
a Schematics shows the strategy used in this study to CRISPR engineer a UFs-relevant specific MED12 mutation in an immortalized smooth muscle cell. b Schematics of the MED12 gene and most frequently observed mutations (red asterisk) are shown at the exon two regions. The WT and the homology-directed repair (HDR) DNA template are shown for the intended MED12 Gly-44→Asn mutation. c Chromatograms show the Sanger sequencing results from genomic DNA and cDNA from WT cells and multiple CRISPR-engineered MED12 Gly-44 clones. d Western blot showing MED12 and b-actin protein levels in control, CRISPR-engineered cells. e CRISPR-TIDE analysis shows the frequency of DNA sequencing reads with WT sequence, homology-directed repaired (MED12 Gly-44 mutant), and indels assessed over several weeks from a population of cells. f Incucyte live cell imaging results show relative proliferation rates of control WT and MED12 Gly-44 mutant cells in 2D culture conditions. Results are average of three biological triplicates imaged at 6 different viewpoints. g Representative images of 3D spheres of WT and MED12 Gly-44 mutant cells in 3D culture conditions. h The bar plot shows relative spheroid volumes from WT and MED12 Gly-44 mutant cells. Results are from one of the biological triplicates and each dot represents a quantified sphere. i The H&E images show representative lesions from WT and MED12 Gly-44 mutant cells grown in kidney capsules in vivo. The dot plot quantifies the lesion surface area at the injected site in mice (n = 6). j The Masson’s trichome staining, showing collagen deposits as blue, indicates overall ECM deposition and collagen production in WT and MED12 mutant tumors. The dot plot quantifies overall trichrome staining intensity normalized to tumor surface area in different mice (n = 6). Error bars in all figures indicate the standard error of the mean. For statistical analysis in f, h, I, j, a two-sided unpaired t test has been used.

