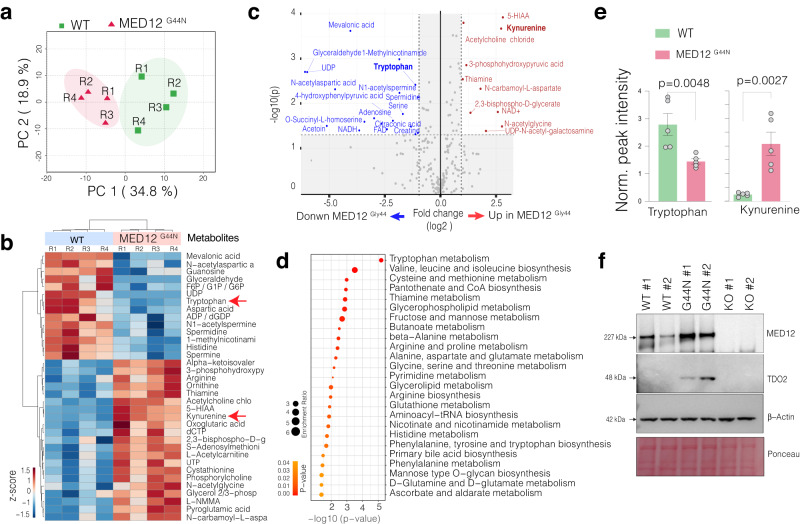
Fig. 2. MED12 Gly-44 mutations result in fibroid-relevant metabolic reprogramming.
a Dimension reduction shows the top two principal components that capture 34.8% and 18.9% variability in the global metabolic differences in the indicated samples. b The heatmap shows the top enriched and depleted metabolites in WT and MED12 Gly-44 mutant cells. Each raw represents a biological replicate (n = 4 total). c The scatterplot shows statistical significance (−log10 p value) versus the magnitude of change (−log 2-fold change) in metabolites of MED12 Gly-44 cells vs. WT cells. d The bar plots show the normalized intensity of LC-MS peaks for Tryptophan and Kynurenine metabolites in indicated cells (n = 5 replicates). Error bars indicate the standard error of the mean. For statistical tests, a two-sided unpaired t test was used. e Dot plots show the p value and enrichment levels of top metabolic terms for the differentially regulated metabolites between WT and MED12 mutant cells. f Western blots show MED12 and TDO2 protein levels, and B-actin and Ponceau S staining is shown for loading control. Whole membrane blots are shown in Supplementary Fig. 12.

