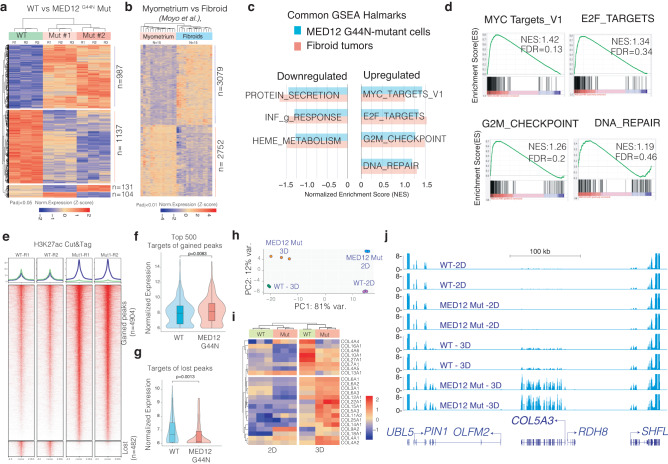
Fig. 3. MED12 Gly-44 mutations cause a fibroid-like transcriptional program that is further enhanced in 3D conditions.
a, b Heatmaps show differentially expressed genes in engineered MED12 mutant cells (a, 3 biological replicates) and primary fibroid tumors (b, n = 15 sample). Gene names are presented in Supplementary Data 2. c The horizontal bar plot shows common hallmarks from Gene Set Enrichment Analysis (GSEA) in engineered MED12 mutant cells and fibroid tumors. d GSEA plots show enriched hallmarks in MED12 mutant vs. WT cells. e Heatmaps show regulatory genomic regions differentially marked by the H3K27ac mark (Cut&Tag signal intensity). f, g Violin plots and box plots show expression levels of gene targets (<10 kb away from the peaks) of gained (f) and lost peaks (g) in MED12 mutant cells. The Wilcoxon signed-rank test was used for p value calculations. In the boxplot, the center line represents the median, the box contains the interquartile range, and the whiskers extend to the 5th and 95th percentiles. h The dot plot shows the top two principal components that explain the largest variation in gene expression programs of indicated cell types under two different culture conditions. i The heatmap shows differentially regulated collagen genes in WT and MED12 mutant cells in 2D and 3D conditions. Each raw represents a biological replicate. j The RNA-Seq tracks show the gene expression level of COL5A3 and neighboring genes in WT and MED12 mutant cells under 2D and 3D conditions.

