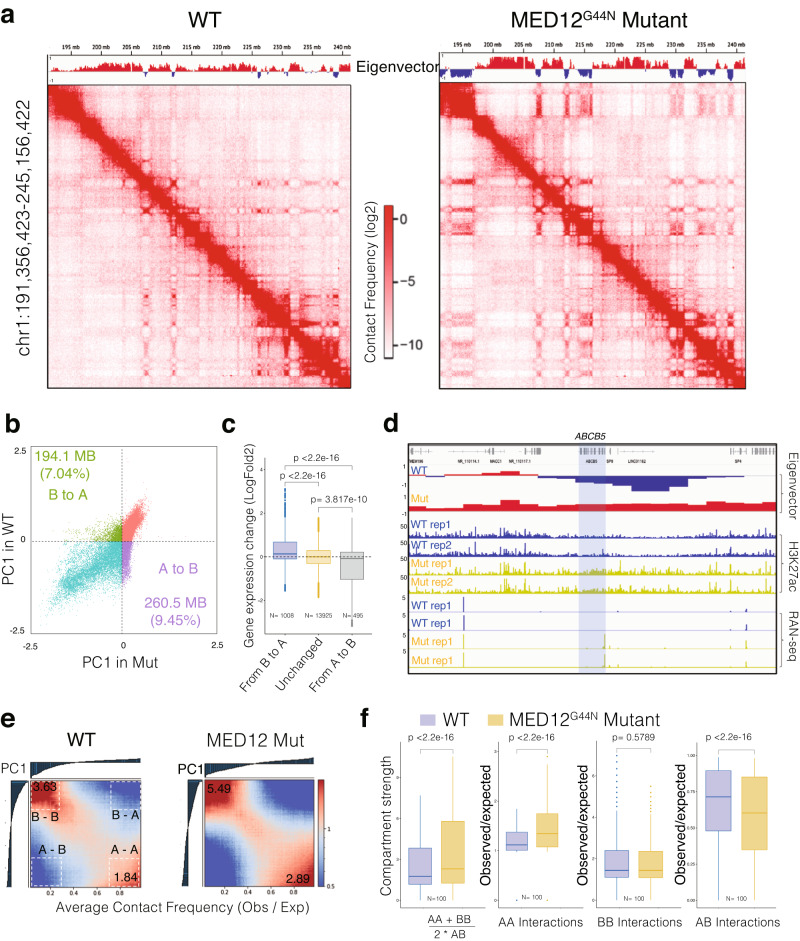
Fig. 5. MED12 Gly-44 mutations lead to genome-wide A/B compartment reorganization.
a Hi-C contact frequency maps at 100 kb resolution (chr1: 191 M–245 M) in WT (left) and MED12 Mut (right) cells. The first principal component values (PC1) of the genomic regions are shown at the top. b Scatterplot of PC1 in WT versus PC1 in Mut illustrating 194,100,000 bp B to A compartment switch regions and 2605000000 bp A to B compartment switch regions after the MED12 mutation. c The boxplots show the log2 fold gene expression change (MED12 mutant vs. WT cells) for the genes located within B to A switch, stable (n = 1008), and A to B switch region (n = 495). In the boxplot, the center line represents the median, the box contains the interquartile range, and the whiskers extend to the 5th and 95th percentiles. The statistical test was performed using a two-sided Wilcoxon test (ns = not significant). d A regional example displaying the gene ABCB5 is located in the B to A switch region after the MED12 mutation, along with regional H3K27ac binding enrichment and expression fold change increase. e Saddle plot displays the genome-wide compartment interaction in wild-type (Left) and MED12 Mut (Right) cells based on Hi-C compartment eigenvectors. f The boxplots show the quantification of the compartment strength, A to A, B to B, and A to B interaction strength in WT and Mut cells, (n = 100). The center line represents the median, the box contains the interquartile range, and the whiskers extend to the 5th and the 95th percentiles. The statistical test was performed using a two-sided Wilcoxon test (ns = not significant).

