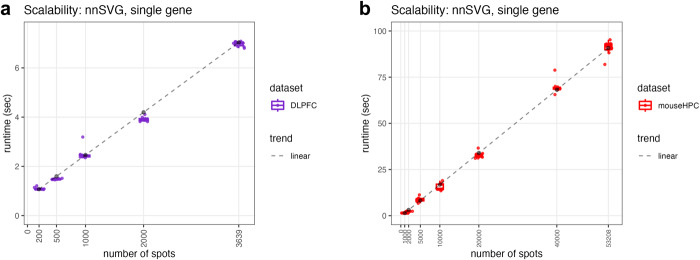
Fig. 3. nnSVG scales linearly with the number of spatial locations.
The runtime in seconds (y-axis) of nnSVG on a single gene (run n = 10 times on a single processor core) using downsampled numbers of spots (x-axis) with two transcriptome-wide datasets, a Visium human DLPFC and b Slide-seqV2 mouse HPC, without quality control or filtering of spots. The dashed lines represent linear trends in scalability for each dataset. Boxplots show medians, first and third quartiles, and whiskers extending to the furthest values no more than 1.5 times the interquartile range from each quartile.

