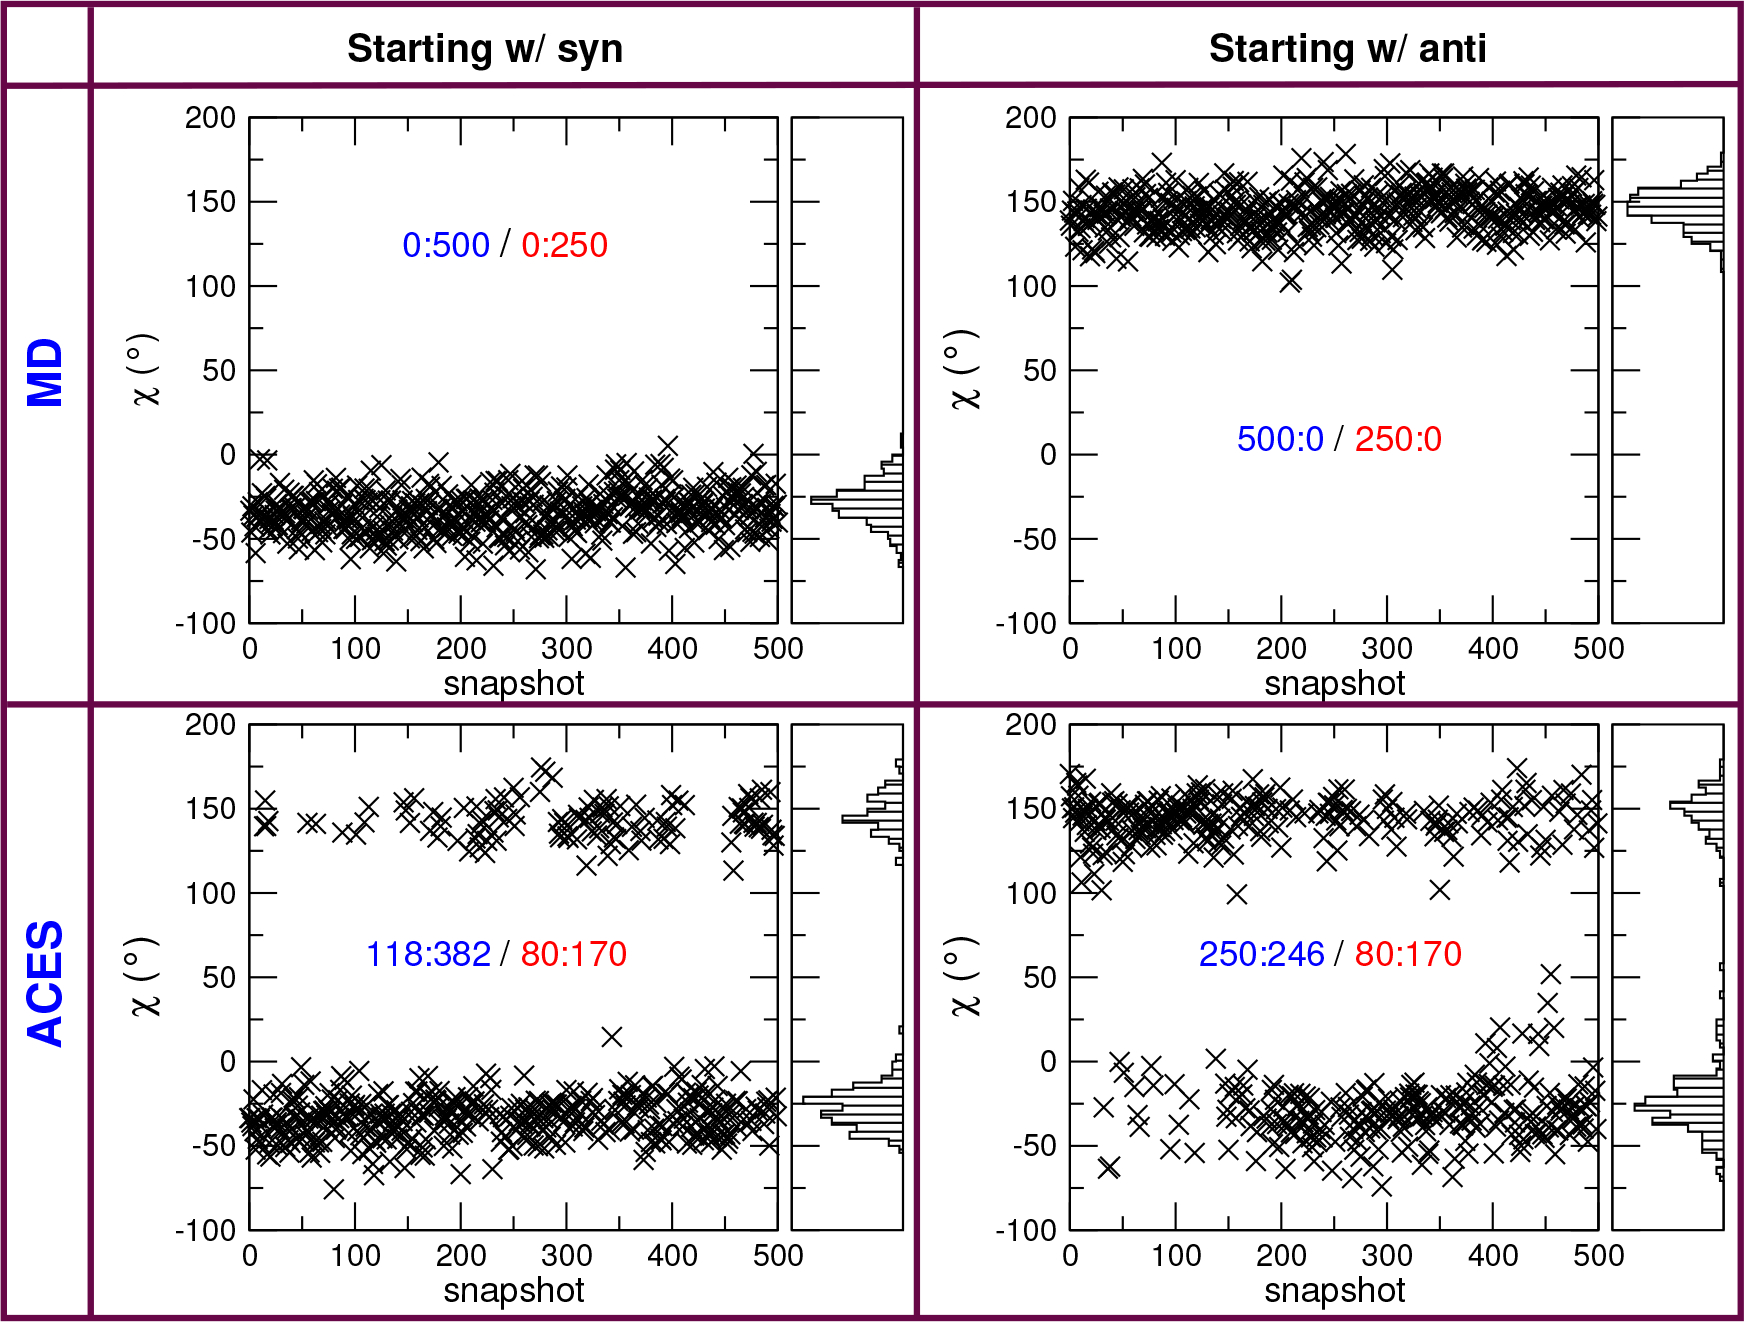
Figure 3:

Time series (5 ns) of the relevant torsion angle with and without ACES from Cdk2–1h1r to Cdk2–1h1q alchemical relative binding simulations. The distributions are for the the real state of 1h1r (λ = 0). Without ACES, the ligand torsion will stay trapped in the initial conformation (syn or anti) for the duration of the simulations. With ACES, the ligand torsion will jump between syn and anti regardless of the initial conformation. The distribution figures are created for the last 2.5 ns data and show that ACES delivers similar distributions for simulations starting from different initial conformations. The number pairs are the counts of (anti:syn) and the blue colored pairs are for all 500 snapshots collected while the red pairs are for the last 250 snapshots (i.e., the last 2.5 ns).
