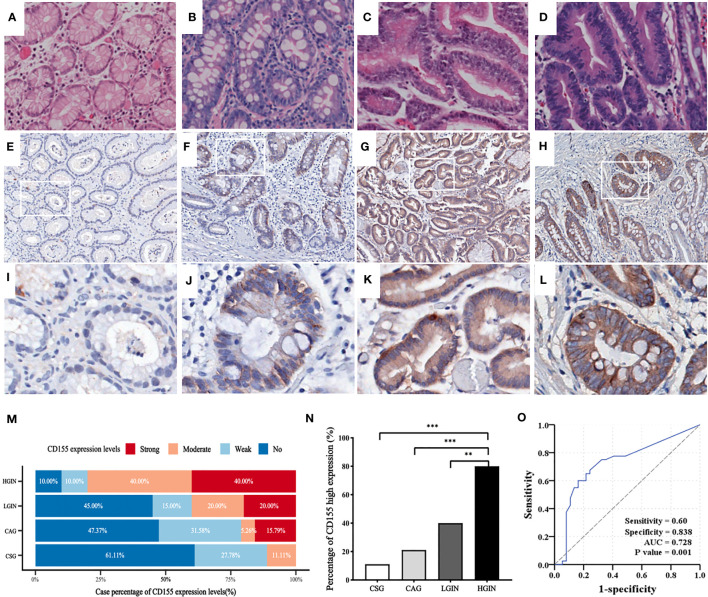
Figure 1.
CD155 expression in distinct stages of GAC development. (A–D) HE staining showing CSG, CAG, LGIN and HGIN, respectively (magnification x200). (E–L) Representative images of CD155 IHC staining in above stages, respectively (upper: magnification x50, lower: magnification x200). (M) CD155 expression levels in different pathological stages. As the development of pathological stage, CD155 expression has an increasing trend in moderate and strong expression groups, and decreasing trend in no and weak groups. (N) Moderate and strong expression were defined as high expression. The proportion of high expression of CD155 has significant difference in four progressing stages (11.1%, 21.1%, 40% and 80% respectively, P <0.0001). Spearman correlation demonstrated that CD155 high expression was positively correlated with the pathological evolution of GAC (r = 0.521, P <0.0001). (O) ROC curve showed predictive power of CD155 expression in process from gastritis to intraepithelial neoplasia by H-score. **P < 0.01, ***P < 0.001. CSG, chronic superficial gastritis; CAG, chronic atrophic gastritis; LGIN, low-grade intraepithelial neoplasia; HGIN, high-grade intraepithelial neoplasia.

