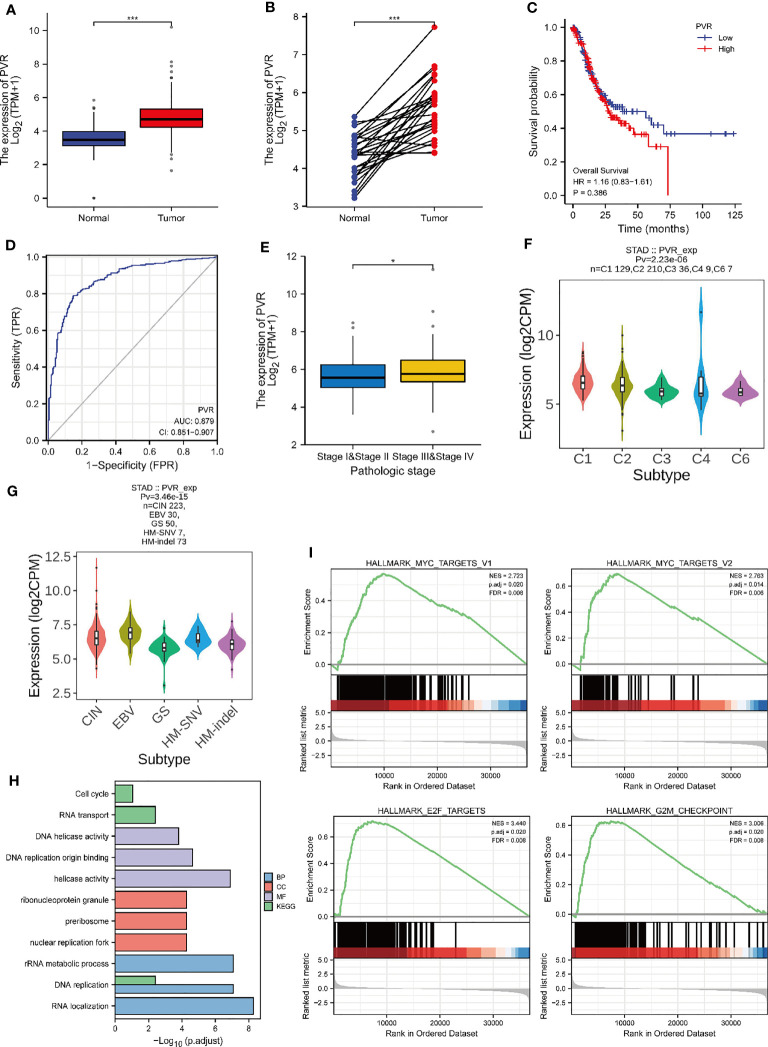
Figure 2.
Relationship between CD155 mRNA expression and gastric cancer progression. The expression level of CD155 in non-paired tumors (A) and paired tumors (B) in comparison with normal tissues. (C) The overall survival of CD155 in the TCGA database. (D) ROC curve analysis of CD155 diagnosis. (E) The CD155 mRNA expression Level in STAD patients with different pathologic stages. (F) CD155 expression level in five immune subtypes in STAD: C1 (wound healing), C2 (IFN-gamma dominant), C3 (inflammatory), C4 (lymphocyte depleted), and C6 (TGF-b dominant). (G) CD155 expression in five molecular subtypes of STAD: CIN, Chromosome Instable; EBV, Epstein Barr virus; GS, Genetic Stable; HM-SNV, Hypermutated-SNV; HM-indel, Hypermutated-indel. (H) GO and KEGG functional enrichment analysis of CD155. (I) Gene set enrichment analysis. *P < 0.05; ***P < 0.001.

