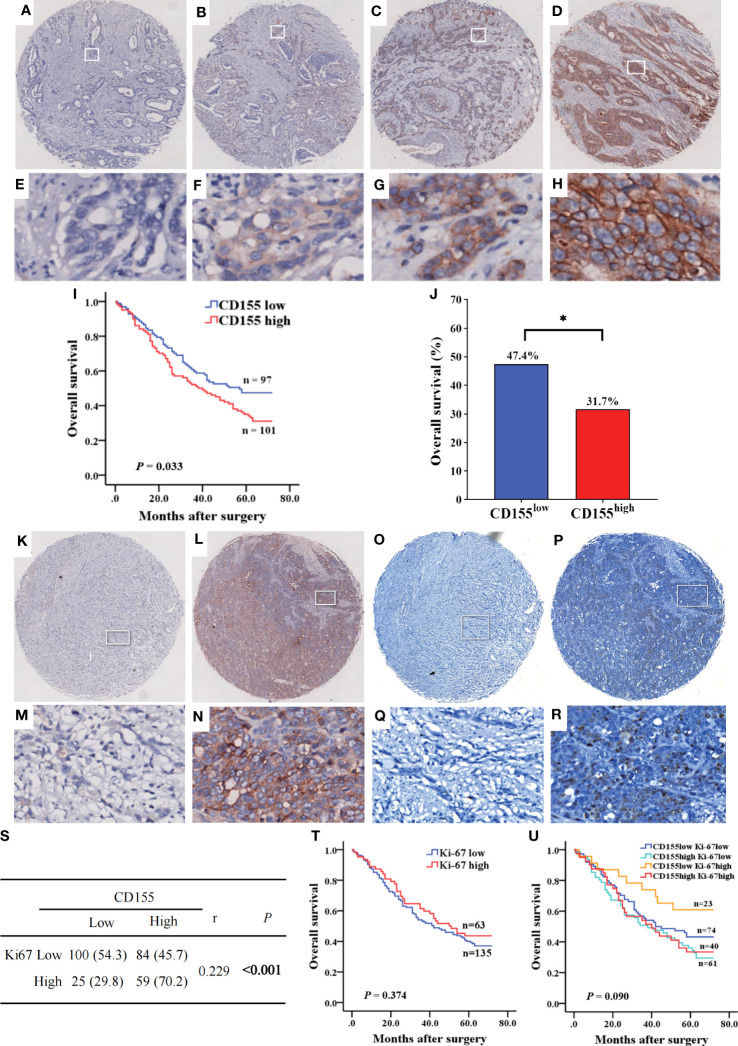
Figure 3.
The expression of CD155 in GAC tissue and its relationship with prognosis of patients. (A–H) Levels of CD155 expression by IHC staining was graded as no, weak, moderate, and strong respectively (above, magnification x25; below, magnification x200). (I) Kaplan-Meier survival curve showed significant difference between low and high CD155 expression (P = 0.033). (J) Overall survival rate was significantly higher in low CD155 expression than high (47.4% vs. 31.7%, P = 0.023). *P < 0.05. (K–R) Identification of CD155 and Ki67 expression in the same GAC samples. (K–N) IHC staining of CD155. (O–R) IHC staining of Ki67. (S) Correlation between CD155 and Ki67 expression by Spearman analysis. (T) Kaplan-Meier survival curve according to low and high levels of Ki67. (U) Kaplan-Meier survival curve according to the combination of CD155 and Ki67 expression. *P < 0.05.

