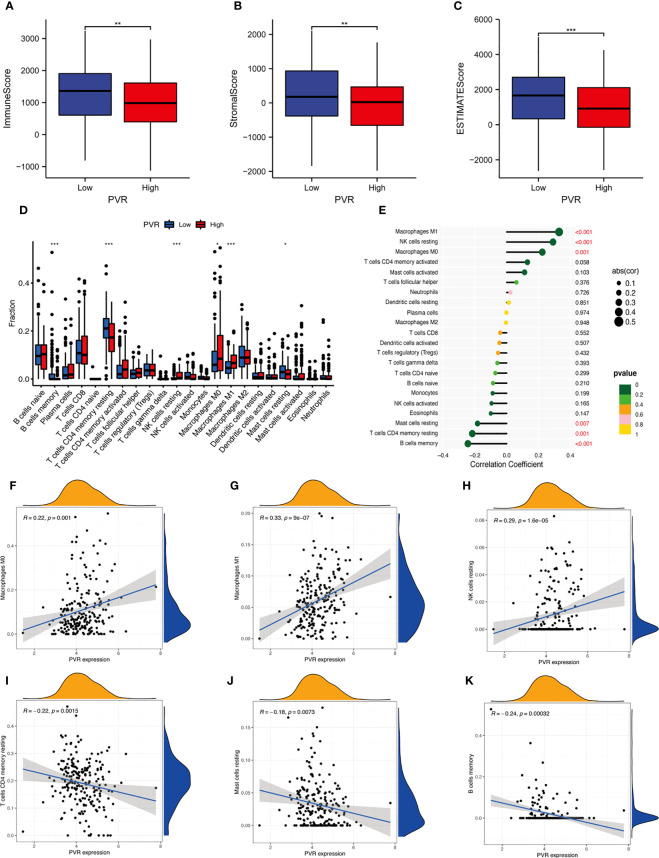
Figure 4.
Correlation between CD155 and tumor immune infiltration. (A–C) Box plots show the immune score (A), stromal score (B), and ESTIMATE score (C) between low- and high-CD155 groups. (D) Relative infiltrating proportion of immune cells in high- and low-CD155 groups. (E) Lollipop graph shows the correlation between CD155 expression and immune cells. (F–K) Scatter plots present the correlation between CD155 expression and immune cells. *p < 0.05; **p < 0.01; ***p < 0.001.

