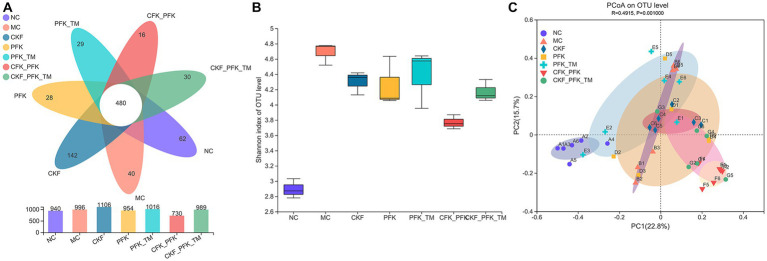
Figure 8.
Changes in the alpha diversity and beta diversity of the gut microbiota in IBS-D rats. (A) Venn diagram. (B) Shannon (alpha diversity index). (C) Principal coordinate analysis (PCoA) analysis of the gut microbiota at OTU level (beta diversity index). The data were represented as mean ± SEM. NC, control group; MC, model control group; CKF, Chang-Kang-Fang group; PFK, Bifico group; PFK-TM, Bifico target-colon capsule group; CKF-D + PFK, Chang-Kang-Fang combined with Bifico group; CKF-D + PFK-TM, Chang-Kang-Fang combined with Bifico target-colon capsule group.

