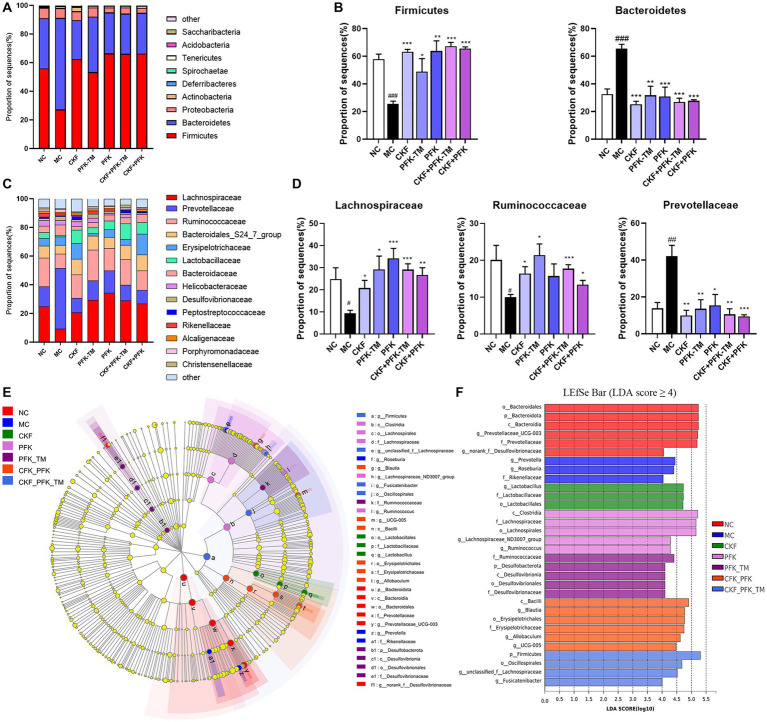
Figure 9.
The structure of the gut microbiota and identification of specific characteristic taxa among seven groups. (A) Relative abundance of distinguishable phyla. (B) Relative abundance of Firmicutes and Bacteroidetes in seven groups. (C) Relative abundance of distinguishable family. (D) Relative abundance of Lachnospiraceae, Ruminococcaceae and Prevotellaceae in seven groups. (E) LEfSe tree diagram of seven groups on the genus level. (F) Differently abundance of intestinal bacteria taxa was obtained by linear discriminant analysis (LDA) score. The data were represented as mean ± SEM. #p < 0.05, ##p < 0.01, ###p < 0.01 vs. NC group, *p < 0.05, **p < 0.01, ***p < 0.001 vs. MC group. NC, control group; MC, model control group; CKF, Chang-Kang-Fang group; PFK, Bifico group; PFK-TM, Bifico target-colon capsule group; CKF-D + PFK, Chang-Kang-Fang combined with Bifico group; CKF-D + PFK-TM, Chang-Kang-Fang combined with Bifico target-colon capsule group.

