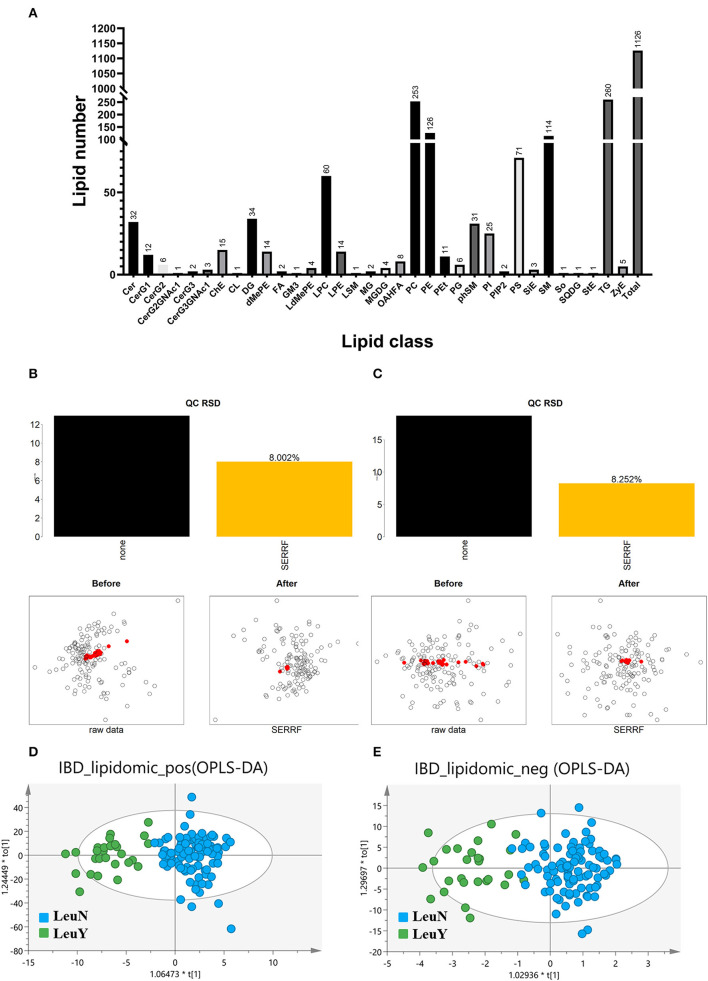
Figure 1.
Untargeted lipidomic analysis. (A) Number of detected lipids based on a untargeted lipidomic. SERRF normalization to remove the unwanted systematic variations for positive (B) and negative (C) mode. The red dots represent QC samples, which are clustered together after SERRF normalization, indicating that systematic errors are eliminated. Scores scatter plot of OPLS-DA in both positive (D) and negative (E) mode. LeuN, the non-leukopenia group. LeuY leukopenia group.

