FIGURE 1.

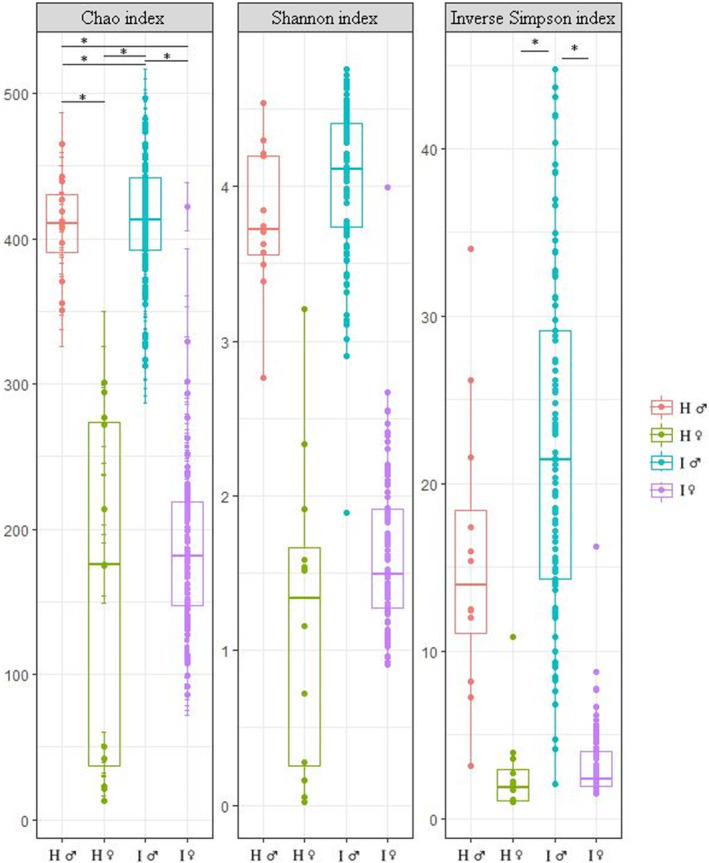
Boxplot of sample groups with different alpha diversity indices. Asterisks indicate differences between the groups (P < 0.05). H, healthy; I, infertile; ♀, woman; ♂, man.

Boxplot of sample groups with different alpha diversity indices. Asterisks indicate differences between the groups (P < 0.05). H, healthy; I, infertile; ♀, woman; ♂, man.