
FIGURE 2.
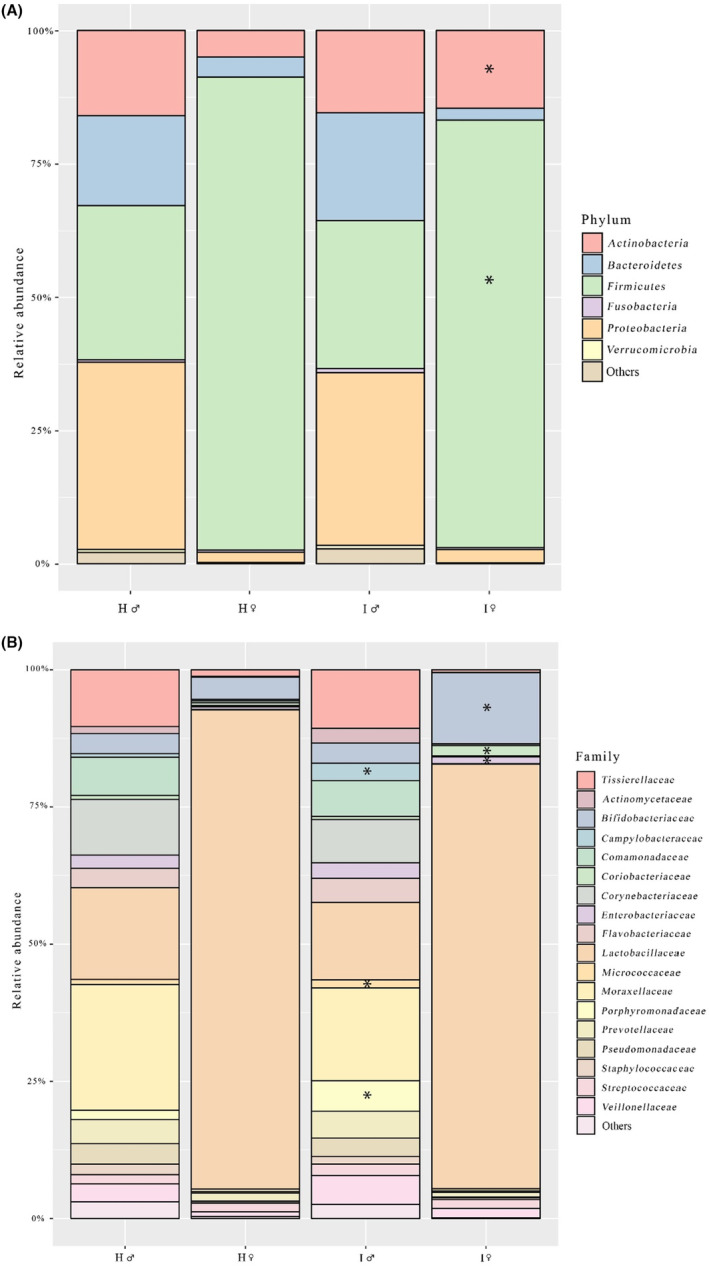
Predominant phyla (A) and families (B) in vaginal and semen samples. Asterisks indicate differences in comparison with healthy controls (P < 0.05). H, healthy; I, infertile; ♀, woman; ♂, man.
Official websites use .gov
A
.gov website belongs to an official
government organization in the United States.
Secure .gov websites use HTTPS
A lock (
) or https:// means you've safely
connected to the .gov website. Share sensitive
information only on official, secure websites.
Predominant phyla (A) and families (B) in vaginal and semen samples. Asterisks indicate differences in comparison with healthy controls (P < 0.05). H, healthy; I, infertile; ♀, woman; ♂, man.