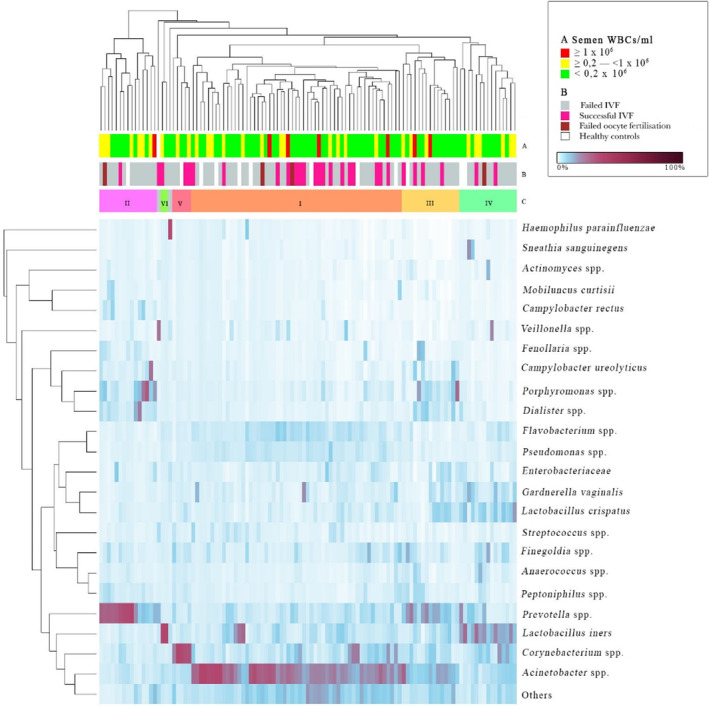
FIGURE 4.

Hierarchical clustering of semen samples. Columns represent semen microbiome and rows represent identified bacterial clusters. A: WBC concentration in semen, B: health status and ART result, C: microbiome community type. Two samples did not cluster into the groups – in one of them, Veillonella predominated and in another, Haemophilus parainfluenzae predominated. ART, assisted reproductive technologies; IVF, in vitro fertilization.
