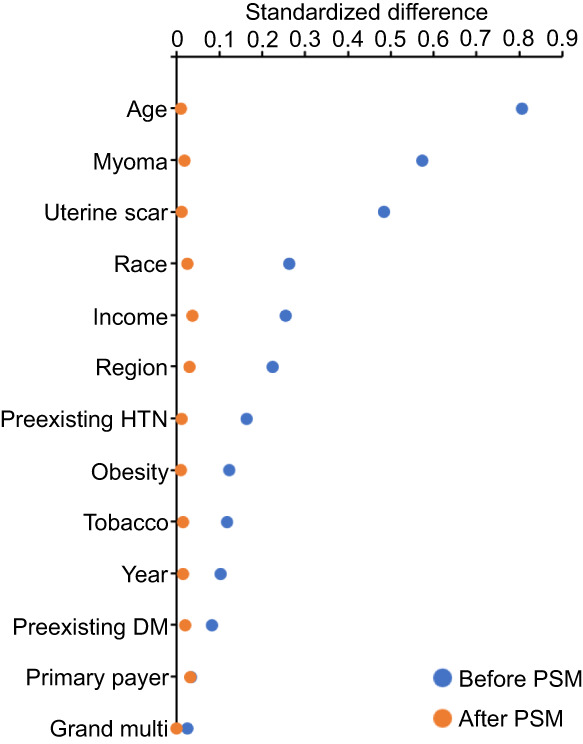
FIGURE 1.

Standardized differences before and after propensity score matching. Standardized differences of >0.20, >0.50, and >0.80 indicate small, moderate, and large clinical imbalance between the two exposure groups (adenomyosis and nonadenomyosis), respectively. DM, diabetes; HTN, hypertension; multi, multiparity; PSM, propensity score matching.
