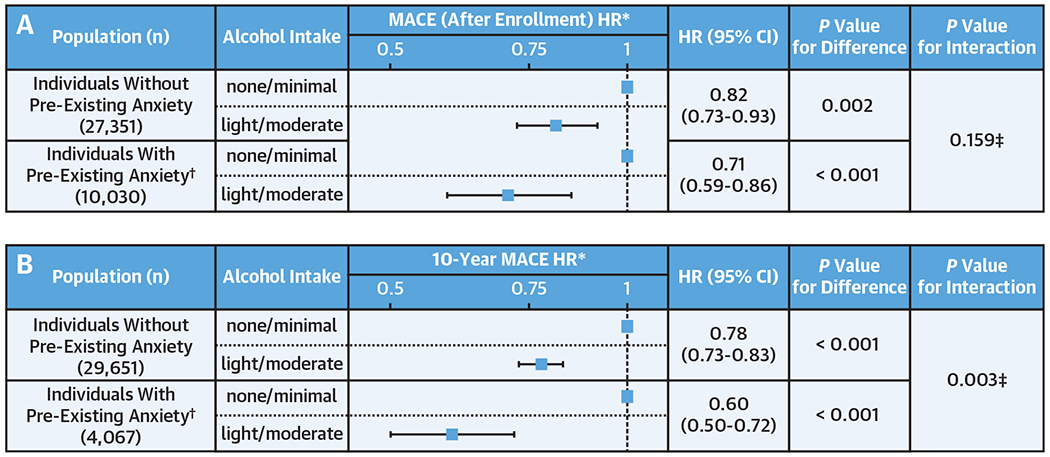
Figure 3. Alcohol Consumption and Cardiovascular Risk in Subjects With vs Without Anxiety.

The figure shows the effect of alcohol consumption on MACE among those with vs without anxiety: (A) incident MACE event analysis (date of enrollment to last follow-up) and (B) 10-year MACE event analysis. HRs are shown as boxes with 95% CIs as bars, displayed in log-scale. *Adjusted for age, sex, and cardiovascular risk factors (hypertension, diabetes mellitus, hyperlipidemia, and smoking). †Anxiety after the index date (date of consent and December 2010, respectively for A and B) is excluded. ‡Interaction term: alcohol consumption (none/minimal vs light/moderate) × history of anxiety (yes vs no).
