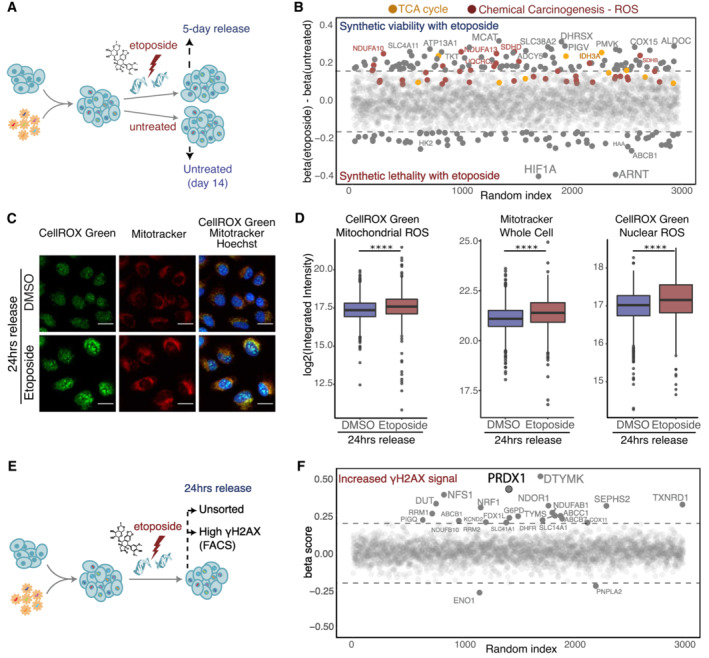
Schematic representation of the etoposide survival CRISPR‐Cas9 screen. Cells were treated with 1 μM of etoposide for 3 h and allowed to recover for 5 days.
Genes synthetic lethal with etoposide survival are represented by negative β scores. Genes contributing to significant enrichment of KEGG terms are colored. The sizes of the labels represent the relative significance of screen hits.
Visualization of ROS (CellROX Green, in green) and mitochondria (Mitotracker, in red) within Hoechst‐stained nuclei (in blue) in U2‐OS WT cells in DMSO treated and 24 h etoposide release conditions. Images were acquired on an Operetta High Content Screening System in confocal mode, scale bar is 25 μm.
Quantification of images shown in (C), represented as log2 integrated intensity. Three biological replicates were performed. A minimum of 1,000 cells were quantified for each condition, using Harmony. Boxplots represent the median within the IQR. P‐values were calculated using linear regression on the log2 normalized values (ns: not significant (P > 0.05), *P < 0.05, **P < 0.01, ***P < 0.001, ****P < 0.0001).
Schematic representation of the etoposide high‐γΗ2ΑΧ CRISPR‐Cas9 screen.
Genes necessary for γΗ2ΑΧ clearance are represented by positive β scores. The sizes of the labels represent the relative significance of screen hits.

