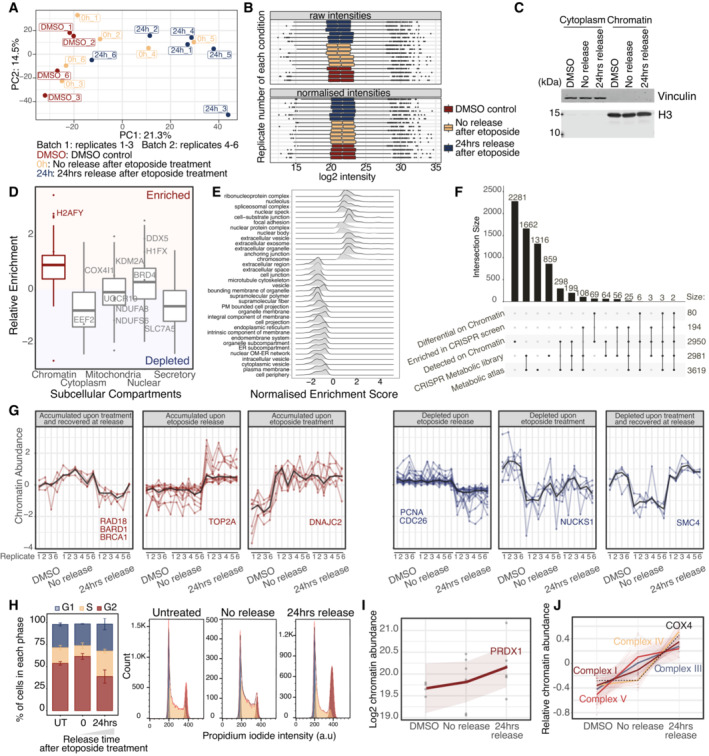
PCA of batch‐corrected chromatin proteomics samples.
Median normalization of raw proteomics intensities. Boxplots represent IQR around the median value for the samples shown in (A).
Western blot confirmation of cell fractionation and chromatin enrichment for one representative replicate.
Enrichment of known chromatin proteins normalized to publicly available U2‐OS whole cell extract, based on the mean of at least four biological replicates. Boxplots represent IQR around the median.
GSEA‐Cellular Components of relative enrichment against publicly available U2‐OS whole cell extract.
Overlap of detected and significant genes between the chromatin and CRISPR‐Cas9 screen datasets.
Behavioral clustering of significant proteins with distinct chromatin recruitment patterns. Shaded area represents the 95% confidence interval around the median (central line).
FACS monitoring cell cycle profiles after etoposide treatment and release of U2‐OS WT cells.
Kinetics of PRDX1 chromatin recruitment upon etoposide release. Shaded area represents the 95% confidence interval around the median (central line) for the biological samples shown in (A).
Relative kinetics of members of ETC complexes chromatin recruitment upon etoposide release. Each protein is centered to its mean value. Shaded area represents the 95% confidence interval around the median (central line) for the biological samples shown in (A).

