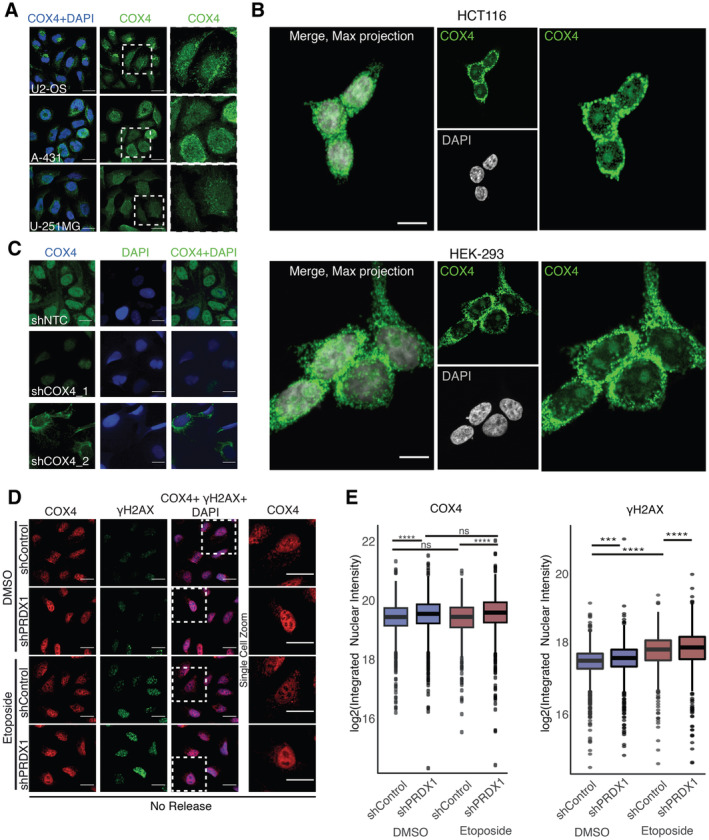
Figure EV3. COX4 nuclear presence.

- Visualization of COX4 (in green) and within DAPI stained nuclei (in blue) in multiple cell lines. Data obtained from the Human Protein Atlas, available from v22.0.proteinatlas.org. Scale bar is 25 μm.
- Visualization of COX4 (in green) within DAPI stained nuclei (in gray) in HCT116 and HEK293 cells. Images were acquired with a Nikon A1R Ultra‐Fast Spectral Scanning Confocal Microscope using a 60× objective. Scale bar is 25 μm.
- Visualization of COX4 (in green) within DAPI stained nuclei (in blue) in U2‐OS shControl and shCOX4 cells. Images were acquired with the Operetta High Content Screening System in confocal mode, scale bar is 25 μm.
- Visualization of COX4 (in red) and γΗ2ΑΧ (in green) within DAPI stained nuclei (in blue) in U2‐OS shControl and shPRDX1 cells at the indicated treatment conditions. Images were acquired with the Operetta High Content Screening System in confocal mode, scale bar is 25 μm.
- Quantification of images shown in (D), represented as nuclear integrated intensities of γΗ2ΑΧ and COX4 signals. Three biological replicates were perfomed. A minimum of 1,000 cells were quantified for each condition, using Harmony. Boxplots represent the median within the IQR. P‐values were calculated using linear regression on the log2 normalized values and the interaction term P‐value between PRDX1 background and etoposide treatment is shown in the plot, where ns: not significant (P > 0.05), *P < 0.05, **P < 0.01, ***P < 0.001, ****P < 0.0001.
