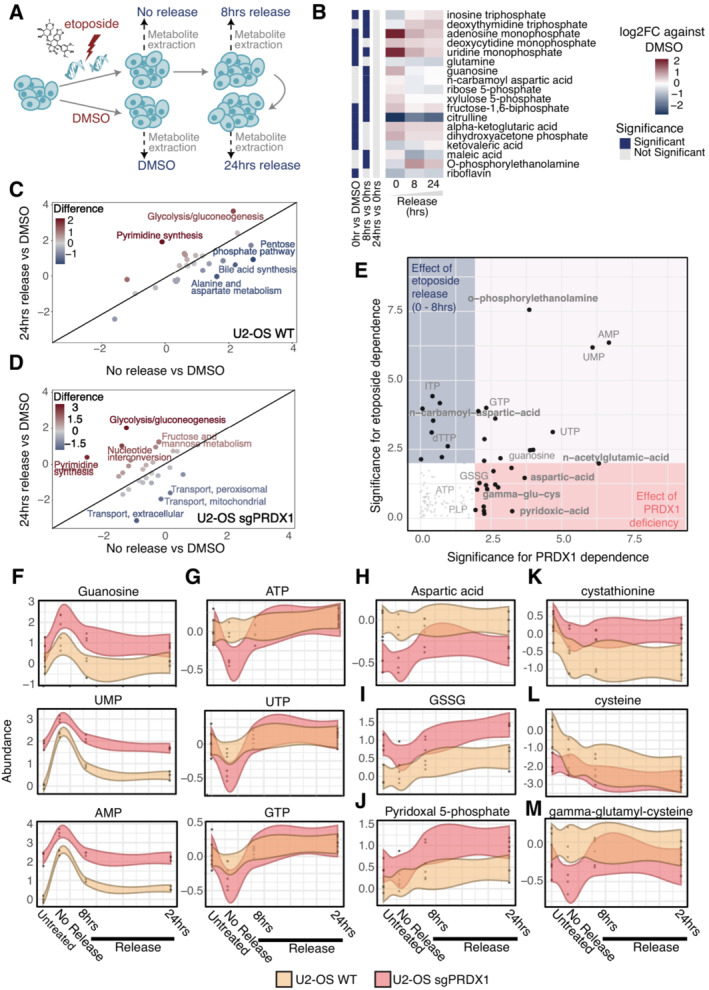
Figure 5. Cellular metabolome is drastically perturbed following etoposide treatment or PRDX1 loss.

-
ASchematic representation of etoposide treatment and release of U2‐OS cells followed by metabolite extraction and LC–MS/MS acquisition.
-
BRelative abundances of metabolites that are significantly perturbed in at least one timepoint, represented as the log2 fold change compared to DMSO control.
-
CMetabolic pathways altered in U2‐OS WT cells at 24 h of etoposide release vs DMSO compared to no release vs DMSO.
-
DMetabolic pathways altered in U2‐OS sgPRDX1 cells at 24 h etoposide release vs DMSO compared to no release vs DMSO.
-
EPRDX1 deficiency‐dependency and etoposide treatment‐dependency of analyzed metabolites, based on linear regression analysis on the 0–8 h release time points.
-
F–MAbundance variations of example metabolites during the etoposide‐release timecourse. Three biological replicates were performed. Shaded area represents the 95% confidence interval.
