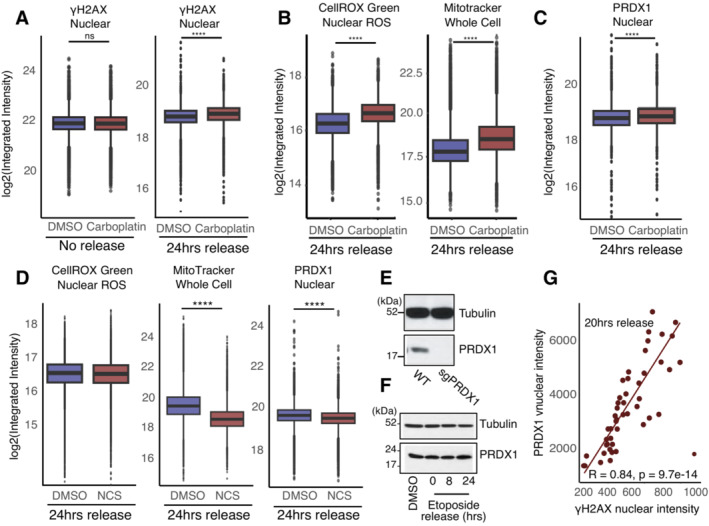
Quantification of nuclear γH2AX integrated intensity without release or 24 h release from Carboplatin compared to DMSO control, in U2‐OS WT cells. Three biological replicates were performed. A minimum of 1,000 cells were quantified for each condition, using Harmony. Boxplots represent the median within the IQR. P‐values were calculated using the Student's t‐test where ns: not significant (P > 0.05), *P < 0.05, **P < 0.01, ***P < 0.001, ****P < 0.0001.
Quantification of nuclear ROS and whole‐cell Mitotracker integrated intensity at 24 h release from Carboplatin compared to DMSO control, in U2‐OS WT cells. Three biological replicates were performed. A minimum of 1,000 cells were quantified for each condition, using Harmony. Boxplots represent the median within the IQR. P‐values were calculated using the Student's t‐test where ns: not significant (P > 0.05), *P < 0.05, **P < 0.01, ***P < 0.001, ****P < 0.0001.
Quantification of nuclear PRDX1 integrated intensity at 24 h of release from Carboplatin compared to DMSO control, in U2‐OS WT cells. Three biological replicates were performed. A minimum of 1,000 cells were quantified for each condition, using Harmony. Boxplots represent the median within the IQR. P‐values were calculated using the Student's t‐test where ns: not significant (P > 0.05), *P < 0.05, **P < 0.01, ***P < 0.001, ****P < 0.0001.
Quantification of nuclear ROS, whole‐cell Mitotracker, and nuclear PRDX1 integrated intensity at 24 h of release from NCS compared to DMSO control, in U2‐OS WT cells. Three biological replicates were performed. A minimum of 1,000 cells were quantified for each condition, using Harmony. Boxplots represent the median within the IQR. P‐values were calculated using the Student's t‐test where ns: not significant (P > 0.05), *P < 0.05, **P < 0.01, ***P < 0.001, ****P < 0.0001.
Immunoblot for PRDX1 and Tubulin on protein extracts from U2‐OS WT and sgPRDX1 cells.
Immunoblot showing PRDX1 abundance in total extracts of U2‐OS cells after etoposide treatment and release in drug‐free media. Tubulin is used as a loading control.
Correlation between γΗ2ΑΧ and PRDX1 nuclear‐integrated intensities in U2‐OS WT cells at 20 h etoposide release.

